Use these links to rapidly review the document
TABLE OF CONTENTS
TABLE OF CONTENTS 2
TABLE OF CONTENTS 3
TABLE OF CONTENTS 4
TABLE OF CONTENTS 5
UNITED STATES
SECURITIES AND EXCHANGE COMMISSION
Washington, D.C. 20549
FORM 10-K
(Mark One)
þ ANNUAL REPORT PURSUANT TO SECTION 13 OR 15(d) OF THE SECURITIES EXCHANGE ACT
OF 1934
For the fiscal year ended December 31, 2017
OR
o TRANSITION REPORT PURSUANT TO SECTION 13 OR 15(d) OF THE SECURITIES EXCHANGE ACT
OF 1934
For the transition period from to
Commission file number 1-8323
CIGNA CORPORATION
(Exact name of registrant as specified in its charter)
| Delaware | 06-1059331 | |
| (State or other jurisdiction of incorporation or organization) | (I.R.S. Employer Identification No.) | |
| 900 Cottage Grove Road, Bloomfield, Connecticut | 06002 | |
| (Address of principal executive offices) | (Zip Code) | |
| (860) 226-6000 | ||
| Registrant's telephone number, including area code | ||
| (860) 226-6741 or (215) 761-5511 | ||
| Registrant's facsimile number, including area code | ||
| | | | | | | | | |
| | SECURITIES REGISTERED PURSUANT TO SECTION 12(B) OF THE ACT: | | ||||||
| | | | | | | | | |
| Title of each class | Name of each exchange on which registered | |||||||
| | | | | | | | | |
| Common Stock, Par Value $0.25 | New York Stock Exchange, Inc. | |||||||
| | | | | | | | | |
| | | | | | | | | |
| | SECURITIES REGISTERED PURSUANT TO SECTION 12(G) OF THE ACT: | | ||||||
| | | | | | | | | |
| NONE | ||||||||
| | | | | | | | | |
| | | | | | | | | | | | | |
| | Indicate by check mark | | Yes | | No | | ||||||
| | | | | | | | | | | | | |
• if the registrant is a well-known seasoned issuer, as defined in Rule 405 of the Securities Act. |
þ | o | ||||||||||
| | | | | | | | | | | | | |
• if the registrant is not required to file reports pursuant to Section 13 or Section 15(d) of the Act |
o | þ | ||||||||||
| | | | | | | | | | | | | |
• whether the registrant (1) has filed all reports required to be filed by Section 13 or 15(d) of the Securities Exchange Act of 1934 during the preceding 12 months (or for such shorter period that the registrant was required to file such reports), and (2) has been subject to such filing requirements for the past 90 days |
þ | o | ||||||||||
| | | | | | | | | | | | | |
• whether the registrant has submitted electronically and posted on its corporate Web site, if any, every Interactive Data File required to be submitted and posted pursuant to Rule 405 of Regulation S-T during the preceding 12 months (or for such shorter period that the registrant was required to submit and post such files). |
þ | o | ||||||||||
| | | | | | | | | | | | | |
• if disclosure of delinquent filers pursuant to Item 405 of Regulation S-K is not contained herein, and will not be contained, to the best of registrant's knowledge, in definitive proxy or information statements incorporated by reference in Part III of this Form 10-K or any amendment to this Form 10-K |
þ | |||||||||||
| | | | | | | | | | | | | |
• whether the registrant is a large accelerated filer, an accelerated filer, a non-accelerated filer, a smaller reporting company or an emerging growth company. See definitions of "large accelerated filer," "accelerated filer, " "smaller reporting company" and "emerging growth company" in Rule 12b-2 of the Exchange Act. |
||||||||||||
| | | | | | | | | | | | | |
| Large accelerated filer þ | Accelerated filer o | Non-accelerated filer o | Smaller reporting company o | |||||||||||||
| | | | | | | | | | | | | | | | | |
| Emerging growth company o | ||||||||||||||||
| | | | | | | | | | | | | | | | | |
• If an emerging growth company, indicate by check mark if the registrant has elected not to use the extended transition period for complying with any new or revised financial accounting standards provided pursuant to Section 13(a) of the Exchange Act. |
o | |||||||||||
| | | | | | | | | | | | | |
• whether the registrant is a shell company (as defined in Rule 12b-2 of the Exchange Act). |
o | þ | ||||||||||
| | | | | | | | | | | | | |
The aggregate market value of the voting stock held by non-affiliates of the registrant as of June 30, 2017 was approximately $42.2 billion. As of January 31, 2018, 242,875,357 shares of the registrant's Common Stock were outstanding.
DOCUMENTS INCORPORATED BY REFERENCE
Part III of this Form 10-K incorporates by reference information from the registrant's definitive proxy statement related to the 2018 annual meeting of shareholders.
Table of Contents
FREQUENTLY REQUESTED 10-K INFORMATION
This Annual Report on Form 10-K contains forward-looking statements within the meaning of the Private Securities Litigation Reform Act of 1995. Forward-looking statements are based on Cigna's current expectations and projections about future trends, events and uncertainties. These statements are not historical facts. Forward-looking statements may include, among others, statements concerning future financial or operating performance, including our ability to deliver personalized and innovative solutions for our customers and clients; future growth, business strategy, strategic or operational initiatives; economic, regulatory or competitive environments, particularly with respect to the pace and extent of change in these areas; financing or capital deployment plans and amounts available for future deployment; our prospects for growth in the coming years; and other statements regarding Cigna's future beliefs, expectations, plans, intentions, financial condition or performance. You may identify forward-looking statements by the use of words such as "believe," "expect," "plan," "intend," "anticipate," "estimate," "predict," "potential," "may," "should," "will" or other words or expressions of similar meaning, although not all forward-looking statements contain such terms.
Forward-looking statements are subject to risks and uncertainties, both known and unknown, that could cause actual results to differ materially from those expressed or implied in forward-looking statements. Such risks and uncertainties include, but are not limited to: our ability to achieve our financial, strategic and operational plans or initiatives; our ability to predict and manage medical costs and price effectively and develop and maintain good relationships with physicians, hospitals and other health care providers; the impact of modifications to our operations and processes; our ability to identify potential strategic acquisitions or transactions and realize the expected benefits of such transactions; the substantial level of government regulation over our business and the potential effects of new laws or regulations or changes in existing laws or regulations; the outcome of litigation, regulatory audits, investigations, actions and/or guaranty fund assessments; uncertainties surrounding participation in government-sponsored programs such as Medicare; the effectiveness and security of our information technology and other business systems; unfavorable industry, economic or political conditions, including foreign currency movements; acts of war, terrorism, natural disasters or pandemics; as well as more specific risks and uncertainties discussed in Part I, Item 1A – Risk Factors and Part II, Item 7 – Management's Discussion and Analysis of Financial Condition and Results of Operations of this Form 10-K and as described from time to time in our future reports filed with the Securities and Exchange Commission (the "SEC").
You should not place undue reliance on forward-looking statements that speak only as of the date they are made, are not guarantees of future performance or results, and are subject to risks, uncertainties and assumptions that are difficult to predict or quantify. Cigna undertakes no obligation to update or revise any forward-looking statement, whether as a result of new information, future events or otherwise, except as may be required by law.
PART I
ITEM 1. Business
ITEM 1. Business |
Overview |
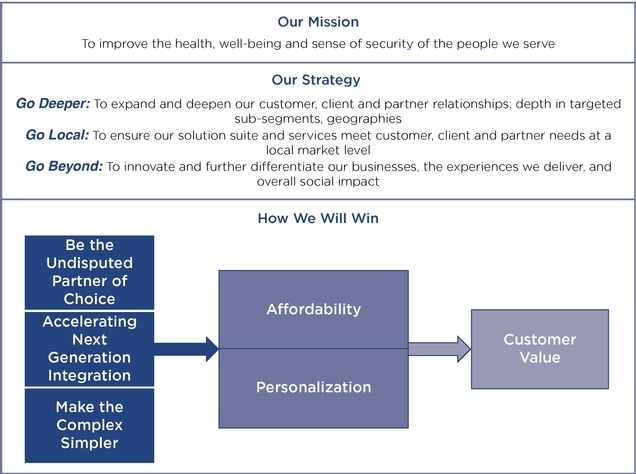
Cigna Corporation, together with its subsidiaries (either individually or collectively referred to as "Cigna," the "Company," "we," "our" or "us") is a global health services organization dedicated to a mission of helping individuals improve their health, well-being and sense of security. Since 2009, our strategy in support of our mission has been to "Go Deep, Go Global and Go Individual". To further accelerate the differentiated value we deliver for our customers, clients, partners and communities, we have evolved this strategy in order to expand avenues for growth and performance. Cigna's evolved strategy is to "Go Deeper", "Go Local" and "Go Beyond".
We execute on this strategy with a differentiated set of medical, pharmacy, behavioral, dental, disability, life and accident insurance and related products and services offered by our subsidiaries.
In an increasingly retail-oriented marketplace, we focus on delivering affordable and personalized products and services to customers through employer-based, government-sponsored and individual coverage arrangements. We increasingly collaborate with health care providers to continue the transition from volume-based fee for service arrangements toward a more value-based system designed to increase quality of care, lower costs and improve health outcomes. We operate a customer-centric organization enabled by keen insights regarding customer needs, localized decision-making and talented professionals committed to bringing our "Together All the Way" brand promise to life.
| | | CIGNA CORPORATION - 2017 Form 10-K 1 |
PART I
ITEM 1. Business
In particular, over the past several years, to achieve the goals of better health, affordability, localization and an improved experience for the customer, we have continued expanding our participation in collaborative care and other delivery arrangements with health care professionals across the care delivery spectrum, including large and small physician groups, specialist groups and hospitals. More recently, we have developed innovative tools and flexible provider arrangements that provide a truly personalized customer experience. These arrangements and tools are discussed in more detail in the "Global Health Care" section of this Annual Report on Form 10-K ("Form 10-K") beginning on page 3.
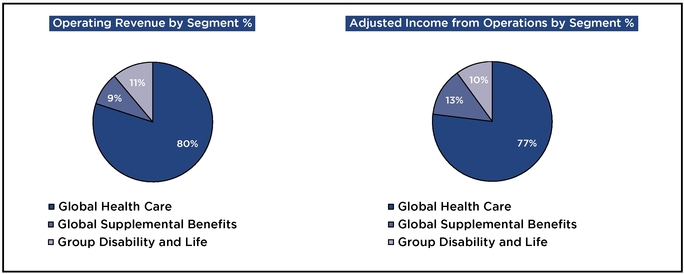
We present the financial results of our businesses in the following three reportable segments:
Global Health Care aggregates the Commercial and Government operating segments.
Global Supplemental Benefits offers supplemental health, life and accident insurance products in selected international markets and in the United States.
Group Disability and Life provides group long-term and short-term disability, group life, accident and specialty insurance products and related services.
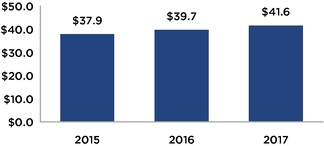
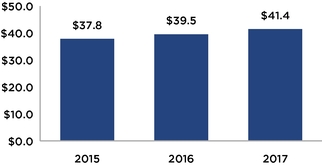
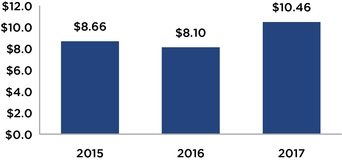
| Financial Results for the year ended and as of December 31, 2017 (in billions) |
|
|||||||
|---|---|---|---|---|---|---|---|---|
| | | | | | | | | |
| Consolidated basis: | | | Consolidated basis: | | | |||
Total revenues |
$ | 41.6 | Shareholders' net income | $ | 2.2 | |||
Operating revenues (1) |
$ | 41.4 | Adjusted income from operations (1) | $ | 2.7 | |||
Total assets |
$ | 61.8 | Total shareholders' equity | $ | 13.7 | |||
| Reportable segments' results: (2) | | | Reportable segments' results: (2) | | | |||
Operating revenues (1) |
$ | 40.9 | Adjusted income from operations (1) | $ | 2.8 | |||
| | | | | | | | | |
We present the remainder of our segment results in Other Operations, consisting of the corporate-owned life insurance business ("COLI"), run-off reinsurance and settlement annuity businesses and deferred gains associated with the sales of the individual life insurance and annuity and retirement benefits businesses.
Our revenues are derived principally from premiums on insured products, fees from self-insured products and services, mail-order pharmacy sales and investment income.
The ACA and Health Care Reform |
The Patient Protection and Affordable Care Act and the Health Care and Education Reconciliation Act (collectively referred to throughout this Form 10-K as the "ACA" or "PPACA") continues to have a significant impact on our business operations. The future of the ACA is uncertain due to congressional efforts to repeal and replace the ACA, various executive actions of the Trump administration, and repeal of the individual mandate as part of H.R.1, An Act to Provide for Reconciliation Pursuant to Titles II and V of the Concurrent Resolution on the Budget for Fiscal Year 2018 (referred to throughout this Form 10-K as the "Tax Cuts and Jobs Act" or "U.S. tax reform legislation"). The effects of the ACA, and efforts to repeal and replace it, are discussed throughout this Form 10-K where appropriate, including in the Global Health Care business description, Regulation, Risk Factors, Management's Discussion and Analysis of Financial Condition and Results of Operations ("MD&A"), and the Notes to the Consolidated Financial Statements.
| 2 CIGNA CORPORATION - 2017 Form 10-K | | |
PART I
ITEM 1. Business
Other Information |
The financial information included in this Annual Report on Form 10-K for the fiscal year ended December 31, 2017 is in conformity with accounting principles generally accepted in the United States of America ("GAAP") unless otherwise indicated. Industry rankings and percentages set forth herein are for the year ended December 31, 2017 unless otherwise indicated. In addition, statements set forth in this document concerning our rank or position in an industry or particular line of business have been developed internally based on publicly available information unless otherwise noted.
Cigna Corporation was incorporated in Delaware in 1981. Our annual, quarterly and current reports, proxy statements and other filings, and any amendments to these filings, are made available free of charge on our website (http://www.cigna.com, under the "Investors – Quarterly Reports and SEC Filings" captions) as soon as reasonably practicable after we electronically file these materials with, or furnish them to, the Securities and Exchange Commission (the "SEC"). We use our website as a channel of distribution for material company information. Important information, including news releases, analyst presentations and financial information regarding Cigna is routinely posted on and accessible at www.cigna.com. See "Code of Ethics and Other Corporate Governance Disclosures" in Part III, Item 10 beginning on page 110 of this Form 10-K for additional available information.
Global Health Care |
| | How We Win | |
| Products and Services | Funding Solutions | |||||||||||||
| | | | | | | | | | | | | | | |
• Medical • Stop Loss • Dental • Vision |
• Pharmacy • Behavioral • Health Advocacy and Coaching |
• Medicare Advantage • Medicare Part D • Medicaid |
• Administrative Services Only (ASO or self-funded) • Insured – Guaranteed Cost • Insured – Experience Rated |
|||||||||||
| | | | | | | | | | | | | | | |
| Physician Engagement | Market Segments | Distribution Channels | ||||||||||||||
| | | | | | | | | | | | | | | | | |
• Collaborative Accountable Care Organizations • Independent Practice Associations • CareAllies® • Delivery System Alliances |
• National • Middle Market • Select • Individual • Government • International |
• Insurance brokers and consultants • Cigna Sales representatives • Cigna private exchange • 3rd party private exchanges • Public exchanges |
||||||||||||||
| | | | | | | | | | | | | | | | | |
We seek to differentiate ourselves in this business by providing innovative personalized and affordable health care benefit solutions to our clients and customers. We sub-segment and target distinct buyer groups in a personalized and localized way. We focus on anticipating, understanding, and meeting their needs and we will continue to drive growth by deepening our approach to consultative partnership, accelerating the value of our integrated solutions, and enhancing the customer experience. As a leader in the drive to transition the health care delivery system from volume-based reimbursements to a value orientation, our strategy is to accelerate our engagement with employers and individuals in order to: 1) increase our customers' involvement in their health care and 2) develop deep insights into customer needs. Our differentiated approach to partnering with health care providers allows us to leverage information, incentives and care resources to help them evolve towards value-based care delivery and improve the quality and affordability of care for our customers and clients.
Innovation is core to the way we do business and will be a critical factor to our success in the highly dynamic health care industry. We have delivered innovative solutions that improve affordability and are more personalized, such as the Cigna One Guide® program that combines a state-of-the-art digital experience with a human concierge service; and the Cigna SureFit® network that allows individual family members to choose their personal care networks, consistent with their health needs and provider preferences.
| | | CIGNA CORPORATION - 2017 Form 10-K 3 |
PART I
ITEM 1. Business
Principal Products and Services |
Commercial Medical Health Plans – U.S. and International
The Commercial operating segment, either directly or through its partners, offers some or all of its products in all 50 states, the District of Columbia, the U.S. Virgin Islands, Canada, Europe, the Middle East, Asia, Africa and Australia. We offer a variety of medical plans including:
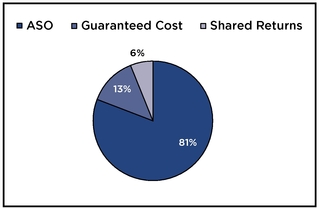
Approximately 90% of our commercial medical customers are enrolled in medical plans with either ASO or experience rated funding arrangements that allow the corporate client to directly benefit from lower medical costs.
The funding arrangements available for our commercial medical and dental health plans are as follows:
| | | | | | | |
| | Funding Solutions: Commercial | | ||||
|
Chart presents percentage of customers by funding solution as of December 31, 2017. ASO • Plan sponsors self-fund all claims, but may purchase integrated stop loss insurance to limit exposure. • We collect fees from plan sponsors for providing access to our participating provider network and for other services and programs including: claims administration; behavioral health; disease management; utilization management; cost
containment; dental; and pharmacy benefit management. |
|
||||
|
Insured – Experience Rated ("Shared Returns" funding suite) • Premium rates are established at the beginning of a policy period and are typically based on prior claim experience of the policyholder. The policyholder receives detailed claim and utilization reporting to understand actual plan costs and
help make informed decisions about future benefit plan design. • The policyholder participates, or shares in, favorable claim experience. When claims and expenses are less than the premium charged (an "experience surplus" or "margin"), the policyholder may be credited for a portion of this experience surplus/margin. If claims and expenses exceed the premium charged (an "experience deficit"), we bear these costs. In certain cases, experience deficits incurred while the policy is in effect are accumulated and may be recovered through future policy year experience surpluses/margins. |
|||||
|
Insured – Guaranteed Cost ("Fully Insured") • Premium rates are established at the beginning of a policy period and, depending on group size, may be based in whole or in part on prior experience of the policyholder or on a pool of similar policyholders. We generally cannot subsequently
adjust premiums to reflect actual claim experience until the next annual renewal. • The policyholder does not participate, or share in, actual claim experience. We keep any experience surplus/margin if costs are less than the premium charged (subject to minimum medical loss ratio rebate requirements discussed below) and bear the risk for actual costs in excess of the premium charged. |
|||||
| | | | | | | |
| 4 CIGNA CORPORATION - 2017 Form 10-K | | |
PART I
ITEM 1. Business
In most states, individual and group insurance premium rates must be approved by the applicable state regulatory agency (typically department of insurance) and state or federal laws may restrict or limit the use of rating methods. Premium rates for groups and individuals are subject to state review for reasonableness. In addition, the ACA subjects individual and small group policy rate increases above an identified threshold to review by the United States Department of Health and Human Services ("HHS") and requires payment of premium refunds on individual and group medical insurance products if minimum medical loss ratio ("MLR") requirements are not met. The MLR represents the percentage of premiums used to pay medical claims and expenses for activities that improve the quality of care. In our individual business, premiums may also be adjusted as a result of the government risk adjustment program that takes into account the relative health status of our customers. See the "Regulation" section of this Form 10-K for additional information on the commercial MLR requirements and the risk mitigation programs of the ACA.
Government Health Plans
Medicare Advantage
We offer Medicare Advantage plans in 17 states and the District of Columbia through our Cigna-HealthSpring brand. Under such a plan, Medicare-eligible beneficiaries may receive health care benefits, including prescription drugs, through a managed care health plan such as our coordinated care plans. A significant portion of our Medicare Advantage customers receive medical care from our value based models that focus on developing highly engaged physician networks, aligning payment incentives to improved health outcomes, and using timely and transparent data sharing. We are focused on continuing to expand these models in the future.
We receive revenue from the Centers for Medicare and Medicaid Services ("CMS") for each plan customer based on customer demographic data and actual customer health risk factors compared to the broader Medicare population. We also may earn additional revenue from CMS related to quality performance measures (known as "Star Ratings"). See the "Executive Overview" section of our MD&A beginning on page 35 of this Form 10-K for additional discussion of our Star Ratings. Premiums may be received from customers when our plan premium exceeds the revenue received from CMS. The ACA requires Medicare Advantage and Medicare Part D plans to meet a minimum MLR of 85%. If the MLR for a CMS contract is less than 85%, we are required to pay a rebate to CMS and could be required to make additional payments if the MLR continues to be less than 85% for successive years.
Medicare Part D
Our Medicare Part D prescription drug program provides a number of plan options, as well as service and information support, to Medicare and Medicaid eligible customers. Our plans are available in all 50 states and the District of Columbia and offer the savings of Medicare combined with the flexibility to provide enhanced benefits and a drug list tailored to individuals' specific needs. Eligible beneficiaries benefit from broad network access and value-added services intended to help keep them well and save them money.
Medicaid
We offer Medicaid coverage to low income individuals in select markets in Texas. We also offered Medicaid coverage to low income individuals in select markets in Illinois throughout 2017; however, as of December 31, 2017, all of our Medicaid contracts with the state of Illinois have been terminated. Our Medicaid customers benefit from many of the coordinated care aspects of our Medicare Advantage programs.
We receive revenue from the states of Texas and Illinois for our Medicaid only customers. For customers eligible for both Medicare and Medicaid ("dual eligible") we receive revenue from both the state and CMS. All revenue is based on customer demographic data and actual customer health risk factors. Similar to Medicare Advantage, there are minimum MLR requirements in Illinois (85% for the dual product and 88% for the Medicaid only product). However, Texas utilizes an experience rebate in an effort to provide better value to consumers and increase transparency. The Texas experience rebate takes into account operating expenses and requires a rebate of dollars to the state as different profitability thresholds are met.
Specialty Products and Services
Our specialty products and services described below are designed to improve the quality of care, lower cost and help customers achieve better health outcomes. Many of these products can be sold on a standalone basis, but we believe they are most effective when integrated with a Cigna-administered health plan. Our specialty products are focused in the areas of medical, behavioral, pharmacy management, dental and vision.
Medical Specialty
| | | CIGNA CORPORATION - 2017 Form 10-K 5 |
PART I
ITEM 1. Business
Pharmacy Management
We offer prescription drug plans to our commercial and government customers both in conjunction with our medical products and on a standalone basis. With a network of over 69,000 pharmacies, Cigna Pharmacy Management is a comprehensive pharmacy benefits manager ("PBM") offering clinical programs and specialty pharmacy solutions. We also offer high quality, efficient, and cost-effective mail order, telephone and on-line pharmaceutical fulfillment services through our home delivery operation.
Our medical and pharmacy coverage meets the needs of customers with complex medical conditions requiring specialty pharmaceuticals. These types of medications are covered under the pharmacy or medical benefit depending on whether they are dispensed by a pharmacy to the customer or administered to the customer by a health care professional or facility. Uses of these typically expensive medications often require associated lab work and coordination between the pharmacy and the patient's medical professionals may be critical in improving clinical outcomes and affordability. Customers with Cigna-administered medical and pharmacy coverage may experience greater continuity of care and affordability, and clients may benefit from integrated reporting and meaningful unit cost discounts on specialty drugs.
Behavioral Health
We arrange for behavioral health care services for customers through our network of approximately 122,000 participating behavioral health care professionals and 14,000 facilities and clinics. We offer behavioral health care case management services, employee assistance programs ("EAP"), and work/life programs to employers, government entities and other groups sponsoring health benefit plans. We focus on integrating our programs and services with medical, pharmacy and disability programs to facilitate customized, holistic care.
Dental
We offer a variety of insured and self-insured dental benefit solutions including dental health maintenance organization plans ("Dental HMO") in 37 states, dental preferred provider organization ("Dental PPO") plans in 49 states and the District of Columbia, exclusive dental provider organization plans, traditional dental indemnity plans and a dental discount program. Employers and other groups can purchase our products as standalone products or in conjunction with medical products. Additionally, individual customers can purchase Dental PPO plans as standalone products or in conjunction with individual medical policies.
Beginning in 2016 Cigna launched a suite of digital enhancements to our web portal and mobile application, for our dental customers to schedule appointments online, compare out-of-pocket costs across multiple dentists, and access information that evaluates the dentist's professional history, affordability and patient experience. Cigna's recent acquisition of Brighter, a leader in digital engagement with health care consumers, will accelerate developing and delivering deep end-to-end experiences that further connect our dental consumers with high quality providers.
As of December 31, 2017, our dental customers totaled 15.8 million worldwide and approximately 67% are enrolled in plans with funding arrangements that allow clients to directly benefit from lower dental costs. Our U.S. customers access care from one of the largest Dental PPO networks and Dental HMO networks, with approximately 140,600 Dental PPO and 19,900 Dental HMO health care professionals.
Vision
Cigna Vision offers flexible, cost-effective PPO coverage that includes a range of both in and out-of-network benefits for routine vision services offered in conjunction with our medical and dental product offerings. Our national vision care network, consisting of approximately 89,800 health care providers in over 26,300 locations, includes private practice ophthalmologist and optometrist offices, as well as retail eye care centers.
Service and Quality |
Customer Service
For U.S.-based customers, we operate 22 service centers that together in 2017 processed approximately 168 million claims and handled 33 million calls providing our customers service 24 hours a day, 365 days a year.
In our international health care business, we have a service model dedicated to the unique needs of our 1.5 million customers around the world. We service them from 12 globally deployed service centers that allow us to provide service 24 hours a day, 365 days a year.
Technology
Cigna Information Technology supports the Go Deeper, Go Local, Go Beyond strategy by focusing first and foremost on strong foundational technology services and delivering against an aligned business and technology portfolio that creates market differentiation. We target specific innovation in the customer experience, digital capabilities, advanced analytics and artificial intelligence that provide key areas of competitive advantage. Our goal is to continue to focus on targeted technology investments to enable our strategic business objectives. This goal is accomplished by delivering innovative technology that enables more efficient operations, improves process integrity and cyber-protections, builds stronger relationships with our key stakeholders; optimizes our economies of scale; and maximizes flexible payment arrangements, innovative products and services and intelligent analytics to support evidence-based medicine. Through continued execution of these capabilities, we are able to better and more rapidly deliver market-differentiating and innovative solutions.
Technology plays an essential role, both as a critical enabler and as a core asset, in Cigna's drive to be the partner of choice and to deliver a superior experience to numerous stakeholders. To support these goals, our global IT strategy continues to focus on technology, infrastructure and platforms, as well as adopting Agile development methods. Execution across each of these dimensions results in improved delivery, quality and speed, stronger integration, improved transparency and greater optionality. As part of the execution of our global IT strategy, we have launched a growing portfolio of innovative solutions that leverage technologies such as virtual reality, mobile, advanced analytics and machine learning. Utilizing virtual reality technology coupled with biometrics and brain wave analysis, we developed a solution that monitors and
| 6 CIGNA CORPORATION - 2017 Form 10-K | | |
PART I
ITEM 1. Business
manages the stress level of call center agents. We also have introduced a global mobile application that enables access to a virtual health team as well as personalized health content, internet of things integration and consolidated medical record information. We are leveraging machine learning and analytics to proactively engage customers with our new, integrated customer decision support and service program, One Guide®. We are also using analytics to address the opioid epidemic. In addition to collaborating with our network of doctors, we leverage our Opioid Likely Overdose Risk Model, which uses machine learning with integrated claims data and analytics to detect opioid use patterns that suggest possible misuse.
Innovation is core to the way we do business; we continuously seek opportunities to drive efficiencies and create a superior customer experience through technology. Our business strategy is predicated on providing customers with differentiated, easy to use, seamless and secure products and solutions that leverage analytics and information to meet their increasing expectations. That means we need to anticipate those needs and meet customers where they are. From predicting and preventing chronic diseases, to mining data to reduce payment and claims fraud, to using the data from wearable's to optimize health, we foresee even more opportunities going forward to use sophisticated artificial intelligence and machine learning techniques. This will allow us to build even better models to answer the complex questions, and will lead to better health care outcomes.
Data Analytics
Cigna has transformed substantial investments in analytics talent, data infrastructure, and machine learning capabilities over the past several years into a closed loop, self-learning insights system that guides our decision making and executing on our strategy. Our Insights That Matter analytics process helps our business leaders identify the questions that matter most to our customers and partners. We focus our data science experts on answering those questions with innovative methodologies and transform our insights into targeted business actions.
Cigna is using advanced analytic capabilities throughout all facets of the business to:
Going forward, we view insights as a strategic imperative and will continue to heavily invest in expanding and strengthening our capabilities to meet and exceed our customer and partner expectations.
Quality Health Care
Our commitment to promoting quality health care to the people we serve is reflected in a variety of activities.
Health Improvement through Engaging Providers and Customers
Cigna improves health outcomes, reduces health care costs, and delivers a better customer and provider experience by enabling optimized relationships that connect care between customers and providers. We refer to this as our Connected Care strategy. Key aspects of this strategy include engaging customers in their health, collaborating with providers to help them improve their performance, and connecting customers and providers through aligned health goals and incentives and actionable information to enable better decisions and outcomes. Cigna is committed to developing innovative solutions that span the health care delivery system and can be applied to different types of providers. Currently we have numerous collaborative arrangements with our participating health care providers and are actively developing new arrangements to support our Connected Care strategy. The key principles that guide our innovative solutions include:
We continue to increase our engagement with physicians and hospitals by rapidly developing the types of arrangements discussed below. Over two million medical customers are currently serviced by more than 136,000 health care providers in these types of arrangements.
| | | CIGNA CORPORATION - 2017 Form 10-K 7 |
PART I
ITEM 1. Business
In the international health care business we use the Net Promoter Score ("NPS") approach to continually gather insights from customers and health care professionals around the world and to guide how we proactively enhance product and service offerings.
Participating Provider Network
We provide our customers with an extensive network of participating health care professionals, hospitals, and other facilities, pharmacies and providers of health care services and supplies. In most instances, we contract with them directly; however, in some instances, we contract with third parties for access to their provider networks and care management services. In addition, we have entered into strategic alliances with several regional managed care organizations (e.g., Tufts Health Plan, HealthPartners, Inc., Health Alliance Plan, and MVP Health Plan) to gain access to their provider networks and discounts.
We credential physicians, hospitals and other health care professionals in our participating provider networks using quality criteria that meet or exceed the standards of external accreditation or state regulatory agencies, or both. Typically, most health care professionals are re-credentialed every three years.
The Cigna Care Network® is a benefit-plan design option offered in 74 service areas. The network distinguishes physicians in 21 specialties (3 primary care and 18 other specialties) who participate in our network, based on specific quality and/or cost-efficiency criteria. The benefit design is intended to encourage Cigna customers to consider using a Cigna Care Network® physician, affords a lower co-payment or coinsurance for services provided by a physician in this network than if the individual were to select a participating, non-Cigna Care Network® physician.
LocalPlus® is a locally-tailored network of select health care providers and facilities designed to provide cost-effective and quality care. It links multiple local networks across geographic markets to provide consistency for both employers and the customers. LocalPlus® was available in 23 markets as of the end of 2017, and will be available in 24 markets by the end of 2018.
The Cigna SureFit® network is built around a focused, local network of doctors and hospitals, who are rewarded for collaborating and providing quality care. Customers choose a primary care provider ("PCP") at enrollment, which helps ensure care is coordinated within the network – creating a better, more affordable customer experience. This creates network efficiencies that result in significant client savings over our Open Access Plus ("OAP") product. Traditional and alternative funding options are paired with integrated medical, pharmacy and behavioral health products to further maximize savings.
Medical Care and Onsite Services
| 8 CIGNA CORPORATION - 2017 Form 10-K | | |
PART I
ITEM 1. Business
External Validation
We continue to demonstrate our commitment to quality and have a broad scope of quality programs validated through nationally recognized external accreditation organizations. We achieved Health Plan accreditation from the NCQA in 38 of our markets. Additional NCQA recognitions include Full Accreditation for Managed Behavioral Healthcare Organization for Cigna Behavioral Health, Accreditation with Performance Reporting for Wellness & Health Promotion, Accreditation for our Disease Management programs and Physician & Hospital Quality Certification for our provider transparency program. We have Full Accreditation for Health Utilization Management, Case Management, Pharmacy Benefit Management and Specialty Pharmacy from URAC, an independent, nonprofit health care accrediting organization dedicated to promoting health care quality through accreditation, certification and commendation. We participate in the NCQA's Health Plan Employer Data and Information Set ("HEDIS®") Quality Compass Report, whose Effectiveness of Care measures are a standard set of metrics to evaluate the effectiveness of managed care clinical programs.
Markets and Distribution |
We offer health care and related products and services in the following market segments:
| % of Medical Customers |
||||||
| | | | | | | |
| National | Multi-state employers with 5,000 or more U.S.-based, full-time employees. We offer primarily ASO funding solutions in this market segment. | | 23% | |||
| Middle Market | Employers generally with 250 to 4,999 U.S.-based, full-time employees. This segment also includes single-site employers with more than 5,000 employees and Taft-Hartley plans and other groups. We offer ASO, experience rated and guaranteed cost insured funding solutions in this market segment. | 53% | ||||
| Select | Employers generally with 51-249 eligible employees. We usually offer ASO with stop loss insurance coverage and guaranteed cost insured funding solutions in this market segment. | | 9% | |||
| Individual | In 2017, we offered plans in fifteen states. We had plans on public health insurance exchanges in seven states (Colorado, Illinois, Maryland, Missouri, North Carolina, Tennessee and Virginia) and off-exchange in eight states (Arizona, California, Connecticut, Florida, Georgia, New Jersey, South Carolina, and Texas). In 2018, we offer plans in nine states. We have plans on public health insurance exchanges in six states (Colorado, Illinois, Missouri, North Carolina, Tennessee, and Virginia) and off-exchange in three states (Arizona, Florida, and New Jersey). Consistent with the regulations for Individual ACA compliant plans, we offer plans only on a guaranteed cost basis in this market segment. | 2% | ||||
| Government | Individuals who are post-65 retirees, as well as employer group sponsored pre- and post-65 retirees. We offer Medicare Advantage, Prescription Drug programs, and Medicaid products in this market segment including dual-eligible members who receive both Medicare and Medicaid benefits. | | 3% | |||
| International | Local and multinational companies, international organizations and governments and their local and globally-mobile employees and dependents working or travelling in more than 190 countries and jurisdictions. We offer guaranteed cost, experience rated insured and ASO funding solutions in this market segment. | 10% | ||||
| | | | | | | |
Cigna Guided Solutions® is Cigna's benefit administration and private exchange solution that targets clients who value fully integrated solutions and focus on engaging employees in their benefit offering. It leverages Cigna's ability to provide a fully integrated solution with our broad spectrum of products, benefit plans, services, and full suite of funding options focused on improving total cost, health, and productivity. Through Cigna Guided Solutions®, employers enjoy simplified administration and the convenience of single source purchasing while employees receive more choice via an easy-to-use shopping experience and year round engagement. Together with integrated robust decision-support tools, employees are able to make personalized decisions to select the right benefit offering and get the most value from their plans.
In addition, Cigna participates on many third party private exchanges. We actively evaluate private exchange participation opportunities as they emerge in the market, and target our participation to those models that best align with our mission and value proposition.
We employ sales representatives to distribute our products and services through insurance brokers and insurance consultants or directly to employers, unions and other groups or individuals. We also employ sales representatives to sell access to our national participating provider network, utilization review services, behavioral health care and pharmacy management services, and employee assistance services directly to insurance companies, HMOs and third party administrators. As of December 31, 2017, our field sales force consisted of over 1,200 sales representatives in 124 field locations. In our Government business, Medicare Advantage enrollment is generally a decision made individually by the customer, and accordingly, sales agents and representatives focus their efforts on in-person contacts with potential enrollees, as well as telephonic and group selling venues.
Competition
Our business is subject to intense competition and continuing industry consolidation creates an even more competitive business environment. In certain geographic locations, some health care companies may have significant market share positions, but no one competitor dominates the health care market nationally. Given the current economic and political environment, we expect a continuing trend of consolidation across the health care industry supply chain (including insurers, hospitals, pharmaceutical companies, and providers).
Competition in the health care market exists both for employers and other groups sponsoring plans and for employees in those instances where the employer offers a choice of products from more than one health care company. Most group insurance policies are subject to annual review by the plan sponsor, who may seek competitive quotations prior to renewal. Since the inception of the Individual Exchange marketplaces many carriers have incurred significant financial losses leading to many exiting the market. With the continued debate regarding the ACA and the health care industry more broadly, it is likely that legislative and regulatory changes to the ACA will occur in the future.
| | | CIGNA CORPORATION - 2017 Form 10-K 9 |
PART I
ITEM 1. Business
The primary competitive factors affecting our business are quality and cost-effectiveness of service and provider networks; effectiveness of medical care management; products that meet the needs of employers and their employees; total cost management; technology; and effectiveness of marketing and sales. Financial strength of the insurer, as indicated by ratings issued by nationally recognized rating agencies, is also a competitive factor. We believe that our health advocacy capabilities, holistic approach to consumer engagement, breadth of product offerings, clinical care and medical management capabilities and array of product funding options are competitive advantages in meeting the diverse needs of our customer base. We also believe that our focus on helping to improve the health, well-being and sense of security of the customers we serve will allow us to differentiate ourselves from our competitors.
Our primary competitors in our U.S.-based health care businesses include:
Our primary competitors in the international health care business include U.S.-based insurers such as Aetna, UnitedHealth Group GeoBlue and MetLife; global competitors such as BUPA and Allianz; and local and regional insurers in a range of countries.
In addition to our traditional competitors, new sources of competition continue to emerge. These newer competitors are focused on delivering lower cost benefits and services through internet-enabled technology that allows consumers to take a more active role in the management of their health. This can be accomplished through financial incentives, access to enhanced quality medical data and other information sharing. The effective use of our health advocacy, customer insight and physician engagement capabilities, along with decision support tools (some of which are web-based) and enabling technology are critical to success in the health care industry, and we believe our capabilities in these areas will be competitive differentiators.
Industry Developments
The health insurance marketplace will continue to be shaped by the ACA over the near term. However, Congressional efforts to repeal and replace the ACA, various executive actions of the Trump administration, and the repeal of the individual mandate as part of the recently signed U.S. tax reform legislation make the future of the ACA uncertain. See the "Regulation" and "Risk Factors" sections of the Form 10-K for additional discussion about these developments.
Global Supplemental Benefits |
| | How We Win | |
|
Products and Services |
Key Geographies and Growth Markets |
Distribution Channels |
||||||||||||||
| | | | | | | | | | | | | | | | | |
• Hospitalization • Dental • Medicare Supplement • Critical Illness • Personal Accident • Term Life • Variable Universal Life • Individual Private Medical Insurance |
• Asia: South Korea, China, Taiwan, Hong Kong, Indonesia and India • Turkey • United States |
• Telemarketing • Home Shopping & Direct Response Television • Independent agents • Bancassurance • Internet |
||||||||||||||
| | | | | | | | | | | | | | | | | |
We continue to distinguish ourselves in the global supplemental health, life and accident businesses through our differentiated direct-to-consumer distribution, customer insights and marketing capabilities. We enter new markets when the opportunity to bring our product and health solutions is attractive. Over the past several years, we have continued to extend our product offerings and geographic reach.
| 10 CIGNA CORPORATION - 2017 Form 10-K | | |
PART I
ITEM 1. Business
Principal Products and Services |
Supplemental Health, Life and Accident Insurance
Supplemental health, life and accident insurance products generally provide simple, affordable coverage of risks for the health and financial security of individuals. Supplemental health products provide specified payments for a variety of health risks and include personal accident, accidental death, critical illness, hospitalization, travel, dental, cancer and other dread disease coverages. We also offer customers individual private medical insurance, term and variable universal life insurance and certain savings products.
Medicare Supplement Plans
We offer individual Medicare Supplement plans that provide retirees with federally standardized Medigap-style plans. Retirees may select among the various plans with specific plan options to meet their unique needs and may visit, without the need for a referral, any health care professional or facility that accepts Medicare throughout the United States.
Pricing and Reinsurance |
Premium rates for our global supplemental benefits products are based on assumptions about mortality, morbidity, customer acquisition and retention, customer demographics, expenses and target profit margins, as well as interest rates. For variable universal life insurance products, fees consist of mortality, administrative, asset management and surrender charges assessed against the contractholder's fund balance. Mortality charges on variable universal life may be adjusted prospectively to reflect expected mortality experience. Most contracts permit premium rate changes at least annually.
A global approach to underwriting risk management allows each local business to underwrite and accept risk within specified limits. Retentions are centrally managed through cost effective use of external reinsurance to limit our liability on per life, per risk and per event (catastrophe) bases.
Markets and Distribution |
Our supplemental health, life and accident insurance products sold in foreign countries are generally marketed through distribution partners with whom the individual insured has an affinity relationship. These products are sold primarily through direct marketing channels, such as outbound telemarketing, and in-branch bancassurance (when we partner with a bank and use the bank's sales channels to sell our insurance products). Marketing campaigns are conducted through these channels under a variety of arrangements with affinity partners, including banks, credit card companies and other financial and non-financial institutions. We also market directly to consumers via direct response television and the Internet. In certain countries, we market our products through captive and third party brokers and agents. Our Medicare supplement product line is distributed primarily through independent agents and telemarketing directly to the consumer.
South Korea represents our single largest geographic market for Global Supplemental Benefits. For information on this concentration of risk for the Global Supplemental Benefits segment's business in South Korea, see "Other Items Affecting Results of Global Supplemental Benefits" in the Global Supplemental Benefits section of the MD&A beginning on page 49 of this Form 10-K.
For our supplemental health, life and accident insurance products sold in foreign markets we are increasingly exposed to geopolitical, currency and other risks inherent in foreign operations. Also, given that we bill and collect a significant portion of premiums through credit cards, a substantial contraction in consumer credit could impact our ability to retain existing policies and sell new policies. A decline in customer retention would result in both a reduction of revenue and an acceleration of the amortization of acquisition-related costs. Changes in regulation for permitted distribution channels also may impact our business or results.
Competition |
We expect that the competitive environment for global supplemental benefits will continue to intensify as U.S., Europe and other regionally-based insurance and financial services providers more aggressively pursue expansion opportunities across geographies, especially in Asia. We believe competitive factors will include branding, product and distribution innovation and differentiation, efficient management of marketing processes and costs, commission levels paid to distribution partners, the quality of claims, local network coverage, customer services and talent acquisition and retention. Additionally, in most overseas markets, perception of financial strength also will likely continue to be an important competitive factor.
Our competitors are primarily locally-based insurance companies, including insurance subsidiaries of banks primarily in Asia and Europe and multi-national companies. Insurance company competitors in this segment primarily focus on traditional product distribution through captive agents, with direct marketing being secondary channels. We estimate that we have less than 3% market share of the total insurance premiums in any given market in which we operate.
In the Medicare supplement business, the principal competitive factors are underwriting and pricing, relative operating efficiency, broker relations and the quality of claims and customer service. Our primary competitors in this business include U.S.-based health insurance companies.
Industry Developments |
Pressure on social health care systems, a rapidly aging population and increased wealth and education in developing insurance markets are leading to higher demand for products providing health insurance and financial security. In the supplemental health, life and accident business, direct marketing channels continue to grow and attract new competitors with industry consolidation among financial institutions and other affinity partners.
Data privacy regulation has tightened in all markets in the wake of data privacy news scandals, impacting affinity partner and customer attitudes toward direct marketing of insurance and other financial services.
| | | CIGNA CORPORATION - 2017 Form 10-K 11 |
PART I
ITEM 1. Business
Most of the businesses in this segment operate through foreign subsidiaries. We continue to maintain a capital management strategy to retain overseas a significant portion of the earnings from these foreign operations. These undistributed earnings are deployed outside of the United States in support of the liquidity and capital requirements of our foreign operations. As a result of U.S. tax reform legislation enacted in December 2017, we recorded additional U.S. taxes of $88 million related to the Company's accumulated unremitted foreign earnings. Most of these taxes were incurred in the Global Supplemental Benefits segment. See the Management's Discussion and Analysis section of this Form 10-K for additional discussion of our capital management strategy and the impact of tax reform.
Group Disability and Life |
| | How We Win | |
| Products and Services | Distribution Channels | |||||||||||
| | | | | | | | | | | | | |
• Short-term disability |
• Personal and voluntary accident |
• Insurance brokers and consultants |
||||||||||
• Long-term disability |
• Business travel accident |
• Sales representatives |
||||||||||
| | | | | | | | | | | | | |
• Leave administration |
• Critical illness, Accidental injury and Hospital indemnity |
|||||||||||
• Paid family leave |
Customer Segments | |||||||||||
• Basic-term life |
||||||||||||
| | | | | | | | | | | | | |
• Voluntary term life |
• National |
|||||||||||
• Group universal life |
• Middle Market |
|||||||||||
• Select |
||||||||||||
| | | | | | | | | | | | | |
Our Group Disability and Life business markets its products and services in all 50 states, the District of Columbia, Puerto Rico, the U.S. Virgin Islands and Canada.
Products and Services |
Group Disability
Long-term and short-term group disability insurance products generally provide a fixed level of income to replace a portion of wages lost because of disability. Group disability coverage is typically employer-paid or a combination of employer and employee-paid, but also may include coverage paid for entirely by employees. As part of our group disability insurance products, we also provide assistance to employees in returning to work and assistance to employers with resources to manage the cost of employee disability. We are an industry leader in helping employees return to work quickly, resulting in higher productivity and lower cost for employers and a better quality of life for their employees.
We seek to integrate the administration of our disability insurance products with other disability benefit programs, behavioral programs, medical programs, social security advocacy and administration of federal Family and Medical Leave Act ("FMLA"), State Leave Laws and other leave of absence programs. We believe this integration provides our customers with increased efficiency and effectiveness in disability claims management, enhances productivity and reduces overall costs to employers. This integration also provides early insight into employees at risk for future disability claims. Coordinating the administration of these disability programs with medical programs offered by our health care business provides enhanced opportunities to influence outcomes, reduce the cost of both medical and disability events and improve the return to work rate. The benefits of this integrated approach also include:
Our disability products and services are offered on a fully insured, experience-rated and ASO basis, although most are fully insured. As measured by 2017 premiums and fees, disability constituted 51% of this segment's business. Approximately 15,400 disability insurance policies covering approximately 8.8 million lives were in force as of December 31, 2017.
Group Life Insurance
Group life insurance products offered include term life and universal life. Group term life insurance may be employer-paid basic life insurance, employee-paid supplemental life insurance or a combination thereof. Group universal life insurance is an employee-paid, voluntary life insurance product in which the owner may accumulate a cash value. The cash value earns interest at rates declared from time to time, subject to a minimum guaranteed contracted rate, and may be borrowed, withdrawn, or, within certain limits, used to fund future life insurance coverage.
| 12 CIGNA CORPORATION - 2017 Form 10-K | | |
PART I
ITEM 1. Business
As measured by 2017 premiums and fees, group life insurance constituted approximately 43% of this segment's business. Approximately 9,200 group life insurance policies covering approximately 6.5 million lives were in force as of December 31, 2017.
Other Products and Services
We also offer personal accident insurance coverage, consisting primarily of accidental death and dismemberment and travel accident insurance to employers. Group accident insurance may be employer-paid or employee-paid. In addition, we offer specialty insurance services that consist primarily of disability and life, accident and hospital indemnity products to professional or trade associations and financial institutions.
We also provide a number of voluntary products and services that are typically paid by the employee and offered at the employer's worksite. Our plans provide employers with administrative solutions designed to provide employers with a complete and simple way to manage their benefits program. In recent years, we have brought to market three additional voluntary offerings: accidental injury insurance, critical illness coverage and hospital indemnity. These products provide additional dollar payouts to employees for unexpected accidents, hospitalization or more serious illnesses.
Pricing and Reinsurance |
Premiums charged for disability and term life insurance products are usually established in advance of the policy period and are generally guaranteed for one to three years and selectively guaranteed for up to five years; policies are generally subject to termination by the policyholder or by the insurance company annually. Premium rates reflect assumptions about future claims, expenses, credit risk, investment returns and profit margins. These assumptions may be based in whole or in part on prior experience of the account or on a pool of accounts, depending on the group size and the statistical credibility of the experience that varies by product.
Premiums for group universal life insurance products consist of mortality and administrative charges assessed against the policyholder's fund balance. Interest credited and mortality charges for group universal life may be adjusted prospectively to reflect expected interest and mortality experience. Mortality charges are subject to maximum guaranteed rates and interest credited on cash values is subject to minimum guaranteed rates as stated in the policy.
The premiums for these products are typically collected within the coverage year and then invested in assets that match the duration of the expected benefit payments that occur over many future years (primarily for disability benefits). With significant investments in longer-duration securities, net investment income is a critical element of profitability for this segment.
The effectiveness of return-to-work programs and morbidity levels will impact the profitability of disability insurance products. Our previous claim experience and industry data indicate a correlation between disability claim incidence levels and economic conditions, with submitted claims rising under adverse economic conditions, although this impact is not clear. For life insurance products, the degree to which future experience deviates from mortality and expense assumptions also affects profitability.
To reduce our exposure to large individual and catastrophic losses under group life, disability and accidental death policies, as well as our more recent accidental injury and critical illness policies, we purchase reinsurance from a diverse group of unaffiliated reinsurers. Our comprehensive reinsurance program consists of excess of loss treaties and catastrophe coverage designed to mitigate earnings volatility and provide surplus protection.
Markets and Distribution |
We market our group disability and life insurance products and services to employers, employees, professional and other associations and groups in the National, Middle Market and Select segments (see definitions of these segments on page 9). In marketing these products, we primarily sell through insurance brokers and consultants and employ a direct sales force consisting of approximately 250 sales professionals in 27 office locations as of December 31, 2017.
Competition |
The principal competitive factors that affect the Group Disability and Life segment are underwriting and pricing, the quality and effectiveness of claims management, relative operating efficiency, investment and risk management, distribution methodologies and producer relations, the breadth and variety of products and services offered, the quality of customer service and, more importantly, the state of the tools and technology available for customers, clients, consultants and producers. For certain products with longer-term liabilities, such as group long-term disability insurance, the financial strength of the insurer, as indicated by ratings issued by nationally recognized rating agencies, is also a competitive factor.
The principal competitors of our group disability, life and accident businesses are other large and regional insurance companies that market and distribute these or similar types of products and include Unum, The Hartford, Prudential, Lincoln and MetLife.
As of December 31, 2017, we are one of the top providers of group disability, life and accident insurance in the United States, based on premiums.
Industry Developments |
Employers are expressing a growing interest in employee wellness, absence management and productivity and likewise are recognizing a strong link between employee health, productivity and their profitability. As this interest grows, we believe our healthy lifestyle and return-to-work programs and integrated family medical leave, disability and health care programs position us to deliver integrated solutions for employers and employees. We also believe that our strong disability management portfolio and fully integrated programs provide tools for employers and employees to improve health status. This focus on managing the employee's total absence enables us to increase the number and effectiveness of interventions and minimize disabling events.
| | | CIGNA CORPORATION - 2017 Form 10-K 13 |
PART I
ITEM 1. Business
The group insurance market remains highly competitive as the rising cost of providing medical coverage to employees has forced companies to re-evaluate their overall employee benefit spending, resulting in lower volumes of group disability and life insurance business and more competitive pricing. Demographic shifts have further driven demand for products and services that are sufficiently flexible to meet the evolving needs of employers and employees who want innovative, cost-effective solutions to their insurance needs. Employers continue to shift towards greater employee participatory coverage and voluntary purchases. With our broad suite of voluntary offerings and continued focus on developing additional voluntary products and service capabilities, we believe we are well positioned to meet the needs of both employers and employees as the market shifts to become more retail-focused.
Over the past few years, there has been heightened review by state regulators of the claims handling practices within the disability and life insurance industry. This has resulted in an increase in coordinated, multi-state examinations that target specific market practices in addition to regularly recurring examinations of an insurer's overall operations conducted by an individual state's regulators. We have been subject to such an examination over the past several years. See Note 21(E) to our Consolidated Financial Statements for additional information.
The depressed level of interest rates in the United States over the last several years has constrained earnings growth in this segment due to lower yields on our fixed-income investments and higher benefit expenses resulting from the discounting of future claim payments at lower interest rates.
Other Operations |
Other Operations includes the following four businesses:
Corporate-owned Life Insurance |
The principal products of the COLI business are permanent insurance contracts sold to corporations to provide coverage on the lives of certain employees for the purpose of financing employer-paid future benefit obligations. Permanent life insurance provides coverage that, when adequately funded, does not expire after a term of years. The contracts are primarily non-participating universal life policies. Fees for universal life insurance products consist primarily of mortality and administrative charges assessed against the policyholder's fund balance. Interest credited and mortality charges for universal life and mortality charges on variable universal life may be adjusted prospectively to reflect expected interest and mortality experience. To reduce our exposure to large individual and catastrophe losses, we purchase reinsurance from unaffiliated reinsurers.
Run-off Settlement Annuity Business |
Our settlement annuity business is a closed, run-off block of single premium annuity contracts. These contracts are primarily liability settlements with approximately 20% of the liabilities associated with payments that are guaranteed and not contingent on survivorship. For contracts that involve non-guaranteed payments, such payments are contingent on the survival of one or more parties involved in the settlement.
Run-off Reinsurance |
Our reinsurance operations are an inactive business in run-off mode.
In February 2013, we effectively exited the guaranteed minimum death benefit ("GMDB") and guaranteed minimum income benefit ("GMIB") business by reinsuring 100% of our future exposures, net of retrocessional arrangements in place at that time, up to a specified limit. For additional information regarding this reinsurance transaction and the arrangements that secure our reinsurance recoverables, see Note 9 to our Consolidated Financial Statements.
Individual Life Insurance and Annuity and Retirement Benefits Businesses |
This business includes deferred gains recognized from the 1998 sale of the individual life insurance and annuity business and the 2004 sale of the retirement benefits business. For more information regarding the arrangements that secure our reinsurance recoverables for the retirement benefits business, see Note 9 to our Consolidated Financial Statements.
Investments and Investment Income |
General Accounts |
Our investment operations provide investment management and related services for our corporate invested assets and the insurance-related invested assets in our General Account ("General Account Invested Assets"). We acquire or originate, directly or through intermediaries, a broad range of investments including private placement and public securities, commercial mortgage loans, real estate, mezzanine, private equity partnerships and short-term investments. Invested assets also include policy loans that are fully collateralized by insurance policy cash values. Invested assets are managed primarily by our subsidiaries and, to a lesser extent, external managers with whom our subsidiaries contract. Net investment income is included as a component of adjusted income from operations for each of our reporting segments and Corporate. Realized investment gains (losses) are reported by segment but excluded from adjusted income from operations. For additional information about invested assets, see the "Investment Assets" section of the MD&A beginning on page 52 and Notes 10 to 12 of our Consolidated Financial Statements.
We manage our investment portfolios to reflect the underlying characteristics of related insurance and contractholder liabilities and capital requirements, as well as regulatory and tax considerations pertaining to those liabilities and state investment laws. Insurance and contractholder liabilities range from short duration health care products to longer term obligations associated with disability and life insurance products and the run-off settlement annuity business. Assets supporting these liabilities are managed in segregated investment portfolios to
| 14 CIGNA CORPORATION - 2017 Form 10-K | | |
PART I
ITEM 1. Business
facilitate matching of asset durations and cash flows to those of corresponding liabilities. Investment strategy and results are affected by the amount and timing of cash available for investment, competition for investments, economic conditions, interest rates and asset allocation decisions. We routinely monitor and evaluate the status of our investments, obtaining and analyzing relevant investment-specific information and assessing current economic conditions, trends in capital markets and other factors such as industry sector, geographic and property-specific information.
Separate Accounts |
Our subsidiaries or external advisors manage Separate Account invested assets on behalf of contractholders; including the Cigna Pension Plan, variable universal life products sold through our corporate-owned life insurance business, and other disability and life products. These assets are legally segregated from our other businesses and are not included in General Account Invested Assets. Income, gains and losses generally accrue directly to the contractholders.
Regulation |
The laws and regulations governing our business continue to increase each year and are subject to frequent change. We are regulated by state, federal and international regulatory agencies that generally have discretion to issue regulations and interpret and enforce laws and rules. These regulations can vary significantly from jurisdiction to jurisdiction, and the interpretation of existing laws and rules also may change periodically. Domestic and international governments continue to enact and consider various legislative and regulatory proposals that could materially impact the health care system.
Our insurance and HMO subsidiaries must be licensed by the jurisdictions in which they conduct business. These subsidiaries are subject to numerous state, federal and international regulations related to their business operations, including, but not limited to:
The business of administering and insuring employee benefit programs in the United States, particularly health care programs, is heavily regulated by state and federal laws and administrative agencies, such as state departments of insurance, and federal agencies including HHS, CMS, the Internal Revenue Service ("IRS") and the Departments of Labor ("DOL"), Treasury and Justice ("DOJ"), as well as the courts. Health savings accounts, health reimbursement accounts and flexible spending accounts also are regulated by the Department of the Treasury and the IRS.
Our operations, accounts and other books and records are subject to examination at regular intervals by regulatory agencies, including state insurance and health and welfare departments, state boards of pharmacy, CMS, DOL, and comparable international regulators to assess compliance with applicable laws and regulations. In addition, our current and past business practices are subject to review by, and from time to time we receive subpoenas and other requests of information from various state insurance and health care regulatory authorities, state attorneys general, the Office of Inspector General ("OIG"), the DOJ, the DOL and other state, federal and international authorities, including inquiries by, and testimony before committees and subcommittees of the U.S. Congress regarding certain of our business practices. These examinations, reviews, subpoenas and requests may result in changes to or clarifications of our business practices, as well as fines, penalties or other sanctions.
Our international subsidiaries are subject to regulations in international jurisdictions where foreign insurers may face more rigorous regulations than their domestic competitors. In addition, the expansion of our operations into foreign countries increases our exposure to certain U.S. laws, such as the Foreign Corrupt Practices Act of 1977 ("FCPA"). See page 19 for further discussion of international regulations.
Patient Protection and the Affordable Care Act (ACA)
The ACA mandated broad changes affecting insured and self-insured health benefit plans that impact our current business model, including our relationship with current and future producers and health care providers, products, services, processes and technology. Several bills were
| | | CIGNA CORPORATION - 2017 Form 10-K 15 |
PART I
ITEM 1. Business
introduced in Congress in 2017 to repeal and replace the ACA, though none had passed the House and Senate. Discussions on the ACA continue in Congress.
Throughout 2017, President Trump took several steps to limit the utility of the ACA. In January 2017, he signed an executive order instructing agencies to waive, defer, grant exemptions from, or delay the implementation of any provision or requirement of the ACA that would impose a fiscal burden on any state or a cost, fee, tax, penalty, or regulatory burden on individuals, providers, insurers, recipients of health care services, purchasers of health insurance or makers of medical devices, products or medications. In October 2017, President Trump issued another executive order that could result in significant changes to the individual and group health insurance markets. Among other things, the executive order permits the expansion of association health plans where small businesses and individuals join together to form a plan. It may also expand the use of short term health plans that generally have lower premiums and less coverage than policies sold on the exchanges. At this time, we are unable to determine the effect, if any, of these actions on our business or results of operations.
Also in October 2017, the Trump administration stopped payment of cost-sharing reduction subsidies to insurers. Cost-sharing reduction subsidies lower the amount that qualifying customers pay for deductibles, copayments and coinsurance. The federal government had provided funding for the cost-sharing reduction subsidies to the qualifying customer's insurer until the President's executive order. The attorneys general of 18 states and the District of Columbia have sued the Trump administration, seeking to require the administration to continue paying these subsidies. While the litigation is at a preliminary stage, in October 2017, the court denied the attorney generals' request for an injunction, allowing the government to cease providing the cost-sharing reduction payments to insurers during the pendency of the matter. We will continue to monitor developments as the case proceeds.
In December 2017, the U.S. tax reform legislation was signed into law that, among other things, repealed the penalty charged to individuals without health insurance, known as the "individual mandate," effective January 1, 2019.
As a result of these actions, the future of the ACA is uncertain.
Key Provisions of the ACA
Various fees, including the health insurance industry tax, were assessed beginning in 2014. The health insurance industry assessment, totaling $14.3 billion in 2018, is not tax deductible. While federal appropriations legislation imposed a one-year moratorium on the industry tax for 2017 and 2019, the industry tax has been reinstated for 2018. For 2020 and beyond, the annual industry tax will equal the amount for the preceding year increased by a rate of premium growth for the preceding year less the rate of growth in the consumer price index for the preceding calendar year. Our share of this industry tax is determined based on our proportion of premiums for both our commercial and government risk businesses to the industry total.
Each state has a state-based, a state and federal partnership, or a federally-facilitated health insurance exchange for individuals and small employer groups to purchase insurance coverage. Because individuals seeking to purchase health insurance coverage either on or off the exchanges are guaranteed to be issued a policy, the ACA provided programs designed to reduce the risk for participating health insurance companies. The ACA includes a permanent program that adjusts premiums based on the relative health status of the customer base ("risk adjustment"). Two other programs, a reinsurance program and a risk corridor program, were temporary in nature (2014-2016).
MLR requirements, as prescribed by HHS, require payment of premium rebates to group and individual policyholders if certain annual MLRs are not met in our commercial business. Expatriate health coverage is excluded from certain provisions of the ACA, including the MLR requirement.
Other provisions of the ACA in effect include reduced Medicare Advantage premium rates, the requirement to cover preventive services with no enrollee cost-sharing, banning the use of lifetime and annual limits on the dollar amount of essential health benefits, increasing restrictions on rescinding coverage and extending coverage of dependents to the age of 26. The employer mandate requires employers with 50 or more full-time employees to offer affordable health insurance that provides minimum value (each as defined under the ACA) to full-time employees and dependent children up to age 26 or be subject to penalties based on employer size. The ACA also changed certain tax laws that effectively limit tax deductions for certain employee compensation paid by health insurers.
Management continues to be actively engaged with the Trump administration, Congress, regulators and policymakers with respect to the ACA. However, President Trump's and Congress' attempts to scale back the ACA, such as through the repeal of the individual mandate, regulatory challenges to the ACA, and pending litigation challenging aspects of the law and related executive orders, will continue to create uncertainty about the ultimate impact of the ACA.
See also the "Executive Overview" section of our MD&A beginning on page 35 of this Form 10-K. In addition, accounting policies around the government's risk mitigation programs are further disclosed in Note 2 to our Consolidated Financial Statements.
Medicare and Medicaid Regulations
Several of our subsidiaries engage in businesses that are subject to federal Medicare regulations, such as:
In our Medicare Advantage and Medicare Part D business, we contract with CMS to provide services to Medicare beneficiaries. As a result, our ability to obtain payment (and the determination of the amount of such payments), enroll and retain members and expand into new service areas is subject to compliance with CMS' numerous and complex regulations and requirements that are frequently modified and subject to administrative discretion. Marketing and sales activities (including those of third-party brokers and agents) are also heavily regulated by CMS and other governmental agencies, including applicable state departments of insurance. We will continue to allocate significant resources to our compliance, ethics and fraud, waste and abuse programs to comply with the laws and regulations governing Medicare Advantage and Medicare Part D programs.
Our Medicare Advantage and Medicare Part D prescription drug plan businesses also have been impacted by the ACA (and other programs) in a variety of ways, including mandated minimum reductions to risk scores, transition of Medicare Advantage "benchmark" rates to Medicare
| 16 CIGNA CORPORATION - 2017 Form 10-K | | |
PART I
ITEM 1. Business
fee-for-service parity, reduced enrollment periods and limitations on disenrollment and mandated consumer discounts on brand name and generic prescription drugs for Medicare Part D plan participants in the coverage gap.
The ACA ties a portion of each Medicare Advantage plan's and Medicare Part D plan's reimbursement to the plan's "Star Rating" by CMS; those plans receiving a rating of four or more stars are eligible for quality-based bonus payments. The Star Rating system considers various measures adopted by CMS, including, for example, quality of care, preventative services, chronic illness management, coverage determinations and appeals and customer satisfaction. The star rating system is subject to change annually by CMS, which may make it more difficult to achieve four stars or greater.
The ACA requires Medicare Advantage and Medicare Part D plans to meet a minimum MLR of 85%. If the MLR for a CMS contract is less than 85%, we are required to pay a penalty to CMS and could be required to make additional payments or be subject to other penalties if the MLR continues to be less than 85% for successive years. Through the ACA and other federal legislation, funding for Medicare Advantage plans has been and may continue to be altered.
Our Medicaid and dual eligible products are also regulated by CMS and state Medicaid agencies that audit our performance to determine compliance with contracts and regulations. We continue to work in collaboration with applicable state agencies regarding our Medicaid plan in Texas to ensure ongoing compliance and sustainability.
Section 111 of the Medicare, Medicaid and SCHIP Extension Act of 2007 requires us to report specific information regarding claimants and claim settlements involving Medicare participants so CMS can recover Medicare funds expended to provide health care treatment to the claimant.
Strict sanctions, including fines and penalties, exclusion from the Medicare and Medicaid programs and criminal penalties may be imposed for non-compliance with these laws and regulations.
Federal and State Audits of Government-Sponsored Health Care Programs
Participation in government-sponsored health care programs subjects us to a variety of federal and state laws and regulations and risks associated with audits conducted under these programs. These audits may occur in years subsequent to our providing the relevant services. These risks may include potential fines and penalties, restrictions on our ability to participate or expand our presence in certain programs and restrictions on marketing our plans. For example, with respect to our Medicare Advantage business, CMS and the OIG perform audits to determine a health plan's compliance with federal regulations and contractual obligations, including program audits, compliance with proper coding practices (sometimes referred to as "Risk Adjustment Data Validation Audits" or "RADV audits"). For our Medicare Part D business, compliance with fraud and abuse enforcement practices is monitored through Recovery Audit Contractor ("RAC") audits in which third-party contractors conduct post-payment reviews on a contingency fee basis to detect and correct improper payments. In addition, negative performance points may be accumulated for noncompliance, including failure to perform satisfactorily during an audit. Negative past performance points could restrict our ability to expand our Medicare Advantage business geographically. The DOJ is currently conducting an industry review of the risk adjustment data submission practices and business processes, including review of medical charts, of Medicare Advantage organizations under Medicare Parts C and D.
The federal government has made investigating and prosecuting health care fraud, waste and abuse a priority. Fraud, waste and abuse prohibitions encompass a wide range of activities, including kickbacks for inducement to refer customers, billing for unnecessary medical services, coding, network adequacy and improper marketing. The False Claims Act (which includes whistleblower provisions) enables the federal government to bring a lawsuit against an entity that it believes has knowingly presented a false or fraudulent request for payment from the federal government, or who has made a false statement or used a false record to get a claim approved. The regulations and contractual requirements in this area are complex, are frequently modified, and are subject to administrative discretion and judicial interpretation. A number of states have also adopted false claims acts and whistleblower provisions. We expect to continue to allocate significant resources to comply with these regulations and requirements and to maintain audit readiness.
Pharmacy-related Laws and Regulations
Certain of our subsidiaries are pharmacies that dispense prescription drugs to participants of benefit plans administered or insured by our HMO and insurance company subsidiaries. These pharmacy-subsidiaries are subject to state licensing requirements and regulation as well as U.S. Drug Enforcement Agency registration requirements, U.S. Food and Drug Administration requirements and third party accreditation requirements. Other laws and regulations affecting our pharmacy-subsidiaries include federal and state laws concerning labeling, packaging, advertising, handling and adulteration of prescription drugs and dispensing of controlled substances.
Our pharmacy benefit management (PBM) services are subject to numerous laws and regulations, including, for example the False Claims Act and federal and state anti-kickback laws. These laws and regulations govern, and proposed legislation and regulations may govern, critical PBM practices, including disclosure, receipt and retention of rebates and other payments received from pharmaceutical manufacturers; receipt and retention of transmission fees from contracted pharmacies; use of, administration of, and/or changes to drug formularies, maximum allowable cost list pricing, and/or clinical programs; disclosure of data to third parties; drug utilization management practices; the level of duty a pharmacy benefit manager owes its customers; configuration of pharmacy networks; the operations of our subsidiary pharmacies; disclosure of negotiated provider reimbursement rates; calculation of customer cost share for prescription drug claims; disclosure of fees associated with administrative service agreements and patient care programs that are attributable to customers' drug utilization; and registration or licensing of pharmacy benefit managers.
Other Federal and State Regulations |
Employee Retirement Income Security Act and the Public Health Service Act
Our domestic subsidiaries sell most of their products and services to sponsors of employee benefit plans that are governed by the Employee Retirement Income Security Act of 1974, as amended ("ERISA"). ERISA is a complex set of federal laws and regulations enforced by the IRS and the Department of Labor, as well as the courts. ERISA regulates certain aspects of the relationship between us, the employers that maintain employee welfare benefit plans subject to ERISA and participants in such plans. Our domestic subsidiaries are subject to requirements
| | | CIGNA CORPORATION - 2017 Form 10-K 17 |
PART I
ITEM 1. Business
imposed by ERISA affecting claim payment and appeals procedures for individual health insurance and insured and self-insured group health plans and for the insured dental, disability, life and accident plans we administer. Our domestic subsidiaries also may contractually agree to comply with these requirements on behalf of the self-insured dental, disability, life and accident plans they administer.
Many provisions of the ACA impacting insured and self-insured group health plans were incorporated into ERISA. The health insurance reform provisions under ERISA were also incorporated into the Public Health Service Act and are directly applicable to health insurance issuers (i.e., health insurers and HMOs).
Plans subject to ERISA also can be subject to state laws and the legal question of whether and to what extent ERISA preempts a state law will continue to be subject to court interpretation.
Privacy, Security and Data Standards Regulations
The federal Health Insurance Portability and Accountability Act of 1996 and its implementing regulations ("HIPAA") imposes minimum standards on health insurers, HMOs, health plans, health care providers and clearinghouses for the privacy and security of protected health information. HIPAA also established rules that standardize the format and content of certain electronic transactions, including, but not limited to, eligibility and claims.
The Health Information Technology for Economic and Clinical Health Act ("HITECH") imposes additional contracting requirements for covered entities, the extension of privacy and security provisions to business associates, the requirement to provide notification to various parties in the event of a data breach of protected health information, and enhanced financial penalties for HIPAA violations, including potential criminal penalties for individuals. In the conduct of our business, depending on the circumstances, we may act as either a covered entity or a business associate.
The federal Gramm-Leach-Bliley Act generally places restrictions on the disclosure of non-public information to non-affiliated third parties, and requires financial institutions, including insurers, to provide customers with notice regarding how their non-public personal information is used, including an opportunity to "opt out" of certain disclosures. State departments of insurance and certain federal agencies adopted implementing regulations as required by federal law.
A number of states have adopted data security laws and regulations regulating data security and requiring security breach notification that may apply to us in certain circumstances and are increasingly focused on protecting individuals from identity theft. Neither HIPAA nor the Gramm-Leach-Bliley privacy regulations preempt more stringent state laws and regulations. In addition, international laws, rules and regulations governing the use and disclosure of personal information are generally more stringent than in the United States, and they vary from jurisdiction to jurisdiction.
The Cybersecurity Information Sharing Act of 2015 ("CISA") encourages organizations to share cyber threat indicators with the federal government and, among other things, directs HHS to develop a set of voluntary cybersecurity best practices for organizations in the health care industry. States have also begun to issue regulations specifically related to cybersecurity. In October 2017, the National Association of Insurance Commissioners ("NAIC") adopted the Insurance Data Security Model Law that creates rules for insurers and other covered entities addressing data security, investigation and notification of breaches. This includes maintaining an information security program based on ongoing risk assessment, overseeing third-party service providers, investigating data breaches and notifying regulators of a cybersecurity event. As the model law is intended to serve as model legislation only, states will need to enact legislation for the model law to become mandatory and enforceable. We will continue to monitor states' activity regarding cybersecurity regulation.
Consumer Protection Laws
We engage in direct-to-consumer activities and are increasingly offering mobile and web-based solutions to our customers. We are therefore subject to federal and state regulations applicable to electronic communications and other consumer protection laws and regulations, such as the Telephone Consumer Protection Act and the CAN-SPAM Act. In particular, the Federal Trade Commission is increasingly exercising its enforcement authority in the areas of consumer privacy and data security, with a focus on web-based, mobile data and "big data." Federal consumer protection laws may also apply in some instances to privacy and security practices related to personally identifiable information.
Dodd-Frank Act and Investment-Related Regulations
The Dodd-Frank Wall Street Reform and Consumer Protection Act (the "Dodd-Frank Act") provides for a number of reforms and regulations in the corporate governance, financial reporting and disclosure, investments, tax and enforcement areas. The Dodd-Frank Act established a Federal Insurance Office (the "FIO") to develop federal policy on insurance matters. While the FIO does not have authority over health insurance, it may have authority over other parts of our business, such as life insurance. Additional rulemaking by the SEC and other regulatory authorities continues. In February 2017, President Trump signed an executive order directing the Secretary of the Treasury to conduct a review of the Dodd-Frank Act. We continue to monitor how these regulations might impact us.
Depending upon their nature, our investment management activities are subject to U.S. federal securities laws, ERISA and other federal and state laws governing investment related activities. In many cases, the investment management activities and investments of individual insurance companies are subject to regulation by multiple jurisdictions.
Office of Foreign Assets Control Sanctions and Anti-Money Laundering
We also are subject to regulation by the Office of Foreign Assets Control of the Department of the Treasury that administers and enforces economic and trade sanctions based on U.S. foreign policy and national security goals against targeted foreign countries and regimes.
Certain of our products are subject to Department of the Treasury anti-money laundering regulations under the Bank Secrecy Act.
In addition, we may be subject to similar regulations in non-U.S. jurisdictions in which we operate.
| 18 CIGNA CORPORATION - 2017 Form 10-K | | |
PART I
ITEM 1. Business
Regulation of Insurance Companies |
Financial Reporting, Internal Control and Corporate Governance
Regulators closely monitor the financial condition of licensed insurance companies and HMOs. States regulate the form and content of statutory financial statements, the type and concentration of permitted investments, and corporate governance over financial reporting. Our insurance and HMO subsidiaries are required to file periodic financial reports and schedules with regulators in most of the jurisdictions in which they do business as well as annual financial statements audited by independent registered public accounting firms. Certain insurance and HMO subsidiaries are required to file an annual report of internal control over financial reporting with most jurisdictions in which they do business. Insurance and HMO subsidiaries' operations and accounts are subject to examination by such agencies. Many states have expanded regulations relating to corporate governance and internal control activities of insurance and HMO subsidiaries as a result of model regulations adopted by the NAIC with elements similar to corporate governance and risk oversight disclosure requirements under federal securities laws.
Guaranty Associations, Indemnity Funds, Risk Pools and Administrative Funds
Most states and certain non-U.S. jurisdictions require insurance companies to support guaranty associations or indemnity funds that are established to pay claims on behalf of insolvent insurance companies. Some states have similar laws relating to HMOs and other payers, such as consumer operated and oriented plans (co-ops) established under the ACA. In the United States, these associations levy assessments on member insurers licensed in a particular state to pay such claims. Certain states require HMOs to participate in guaranty funds, special risk pools and administrative funds. For additional information about guaranty fund and other assessments, see Note 21 to our Consolidated Financial Statements.
Certain states continue to require health insurers and HMOs to participate in assigned risk plans, joint underwriting authorities, pools or other residual market mechanisms to cover risks not acceptable under normal underwriting standards, although some states have eliminated these requirements as a result of the ACA.
Solvency and Capital Requirements
Many states have adopted some form of the NAIC model solvency-related laws and risk-based capital rules ("RBC rules") for life and health insurance companies. The RBC rules recommend a minimum level of capital depending on the types and quality of investments held, the types of business written and the types of liabilities incurred. If the ratio of the insurer's adjusted surplus to its risk-based capital falls below statutory required minimums, the insurer could be subject to regulatory actions ranging from increased scrutiny to conservatorship.
In addition, various non-U.S. jurisdictions prescribe minimum surplus requirements that are based upon solvency, liquidity and reserve coverage measures. Our HMOs and life and health insurance subsidiaries, as well as non-U.S. insurance subsidiaries, are compliant with applicable RBC and non-U.S. surplus rules.
The Risk Management and Own Risk and Solvency Assessment Model Act ("ORSA"), adopted by the NAIC, provides requirements and principles for maintaining a group solvency assessment and a risk management framework and reflects a broader approach to U.S. insurance regulation. ORSA includes a requirement to file an annual ORSA Summary Report in the lead state of domicile. To date, an overwhelming majority of the states have adopted the same or similar versions of ORSA. We file our ORSA report annually as required.
Holding Company Laws
Our domestic insurance companies and certain of our HMOs are subject to state laws regulating subsidiaries of insurance holding companies. Under such laws, certain dividends, distributions and other transactions between an insurance company or an HMO subsidiary and its affiliates may require notification to, or approval by, one or more state insurance commissioners. In addition, the holding company acts of states in which our subsidiaries are domiciled restrict the ability of any person to obtain control of an insurance company or HMO subsidiary without prior regulatory approval.
Marketing, Advertising and Products
In most states, our insurance companies and HMO subsidiaries are required to certify compliance with applicable advertising regulations on an annual basis. Our insurance companies and HMO subsidiaries are also required by most states to file and secure regulatory approval of products prior to the marketing, advertising, and sale of such products.
Licensing Requirements
Certain subsidiaries contract to provide claim administration, utilization management and other related services for the administration of self-insured benefit plans. These subsidiaries may be subject to state third-party administration and other licensing requirements and regulation, as well as third party accreditation requirements.
Our international subsidiaries are often required to be licensed when entering new markets or starting new operations in certain jurisdictions. The licensure requirements for these subsidiaries vary by country and are subject to change.
International Regulations |
Our operations outside the United States expose us to laws of multiple jurisdictions and the rules and regulations of various governing bodies and regulators, including those related to financial and other disclosures, corporate governance, privacy, data protection, data mining, data transfer, intellectual property, labor and employment, consumer protection, direct-to-consumer communications activities, tax, anti-corruption and anti-money laundering. Foreign laws and rules may include requirements that are different from or more stringent than similar requirements in the United States.
| | | CIGNA CORPORATION - 2017 Form 10-K 19 |
PART I
ITEM 1. Business
Our operations in countries outside the United States:
In particular, in South Korea where we are selling insurance products directly to individual customers, regulators are focused on protecting the rights of individual customers by enforcing "Treating Customers Fairly" concepts. This regulatory focus results in rigorous data localization requirements, network separation obligations, and system monitoring restrictions, as well as obligations to closely monitor marketing communications and sales scripts. Anti-money laundering requirements in South Korea also impose obligations on the Company to collect certain information about each customer at time of sale and to risk rank each customer to determine possible future money laundering risk.
The FCPA prohibits offering, promising, providing or authorizing others to give anything of value to a foreign government official or employee to obtain or retain business or otherwise secure a business advantage. Outside of the United States, we may interact with government officials in several different capacities: as regulators of our insurance business; as clients or partners who are state-owned or partially state-owned; as health care professionals who are employed by the government; and as hospitals that are state-owned. Violations of the FCPA and other anti-corruption laws may result in severe criminal and civil sanctions as well as other penalties, and the SEC and Department of Justice have increased their enforcement activities with respect to FCPA. The UK Bribery Act of 2010 applies to all companies with a nexus to the United Kingdom. Under this act, any voluntary disclosures of FCPA violations may be shared with United Kingdom authorities, thus potentially exposing companies to liability and potential penalties in multiple jurisdictions.
If our employees or agents fail to comply with applicable laws governing our international operations, we may face investigations, prosecutions and other legal proceedings and actions that could result in civil penalties, administrative remedies and criminal sanctions. See the Risk Factors section beginning on page 21 for a discussion of risks related to our global operations.
Miscellaneous |
Premiums and fees from CMS represented 17% of our total consolidated revenues for the year ended December 31, 2017 under a number of contracts. We are not dependent on business from one or a few customers. Other than CMS, no one customer accounted for 10% or more of our consolidated revenues in 2017. We are not dependent on business from one or a few brokers or agents. In addition, our insurance businesses are generally not committed to accept a fixed portion of the business submitted by independent brokers and agents, and generally all such business is subject to approval and acceptance.
We had approximately 46,000 employees as of December 31, 2017.
| 20 CIGNA CORPORATION - 2017 Form 10-K | | |
PART I
ITEM 1A. Risk Factors
ITEM 1A. Risk Factors |
As a large company operating in a complex industry, we encounter a variety of risks and uncertainties that could have a material adverse effect on our business, liquidity, results of operations, financial condition or the trading price of our securities. You should carefully consider each of the risks and uncertainties discussed below, together with other information contained in this Annual Report on Form 10-K, including Management's Discussion and Analysis of Results of Operations and Financial Condition. These risks and uncertainties are not the only ones we face. Additional risks and uncertainties not presently known to us or that we currently believe to be immaterial may also adversely affect us. The following risk factors have been organized by category for ease of use; however many of the risks may have impacts in more than one category. These categories, therefore, should be viewed as a starting point for understanding the significant risks facing us and not as a limitation on the potential impact of the matters discussed. Risk factors are not necessarily listed in order of importance.
Strategic and Operational Risks |
Future performance of our business will depend on our ability to execute our strategic and operational initiatives effectively.
The future performance of our business will depend in large part on our ability to effectively implement and execute our strategic and operational initiatives including: (1) driving value creation in our targeted areas of business growth; (2) pursuing additional opportunities to expand our capabilities through solutions, segments, distribution channels and geographies; and (3) creating additional value through capital deployment. Successfully executing on these initiatives depends on a number of factors, including our ability to:
If these initiatives fail or are not executed on effectively, our consolidated financial position and results of operations could be negatively affected. For example, efforts to reduce operating expenses while maintaining the necessary resources and talent pool are important and, if not managed effectively, could have long-term effects on our business by negatively impacting our ability to drive improvements in the quality of our products and services. For our strategic initiatives to succeed, we must effectively integrate our operations, including our acquired businesses, actively work to ensure consistency throughout the organization, and promote a global mind-set along with a focus on individual customers. If we fail to do so, our business may be unable to grow as planned, or the result of expansion may be unsatisfactory. In addition, the current competitive, economic and regulatory environment requires our organization to adapt rapidly and nimbly to new opportunities and challenges. We will be unable to do so if we do not make important decisions quickly, define our appetite for risk specifically, implement new governance, managerial and organizational processes smoothly and communicate roles and responsibilities clearly.
We face price competition and other pressures that could result in premiums that are insufficient to cover the cost of the health care services delivered to our customers.
While health plans compete on the basis of many service and quality-related factors, we expect that price will continue to be a significant basis of competition. Our client and customer contracts are subject to negotiation as clients and customers seek to contain their costs, including by reducing benefits offered or elected. Increasingly, our clients seek to negotiate performance guarantees that require us to pay penalties if the guaranteed performance standard is not met. As brokers and benefit consultants seek to enhance their revenue streams, they look to take on services that we typically provide. Alternatively, our clients and customers may purchase different types of products that are less profitable, or move to a competitor to obtain more favorable pricing. Each of these events would likely negatively impact our financial results.
Further, federal and state regulatory agencies may restrict our ability to implement changes in premium rates. For example, the ACA includes an annual rate review requirement to prohibit unreasonable rate increases in the individual and small group health insurance markets and established minimum medical loss ratios for certain plans, which could make it more difficult to obtain price increases. Fiscal concerns regarding the continued viability of programs such as Medicare may cause decreasing reimbursement rates, delays in premium payments or
| | | CIGNA CORPORATION - 2017 Form 10-K 21 |
PART I
ITEM 1A. Risk Factors
insufficient increases in reimbursement rates for government-sponsored programs in which we participate. Any limitation on our ability to maintain or increase our premium or reimbursement levels, or a significant loss of customers resulting from our need to increase or maintain premium or reimbursement levels, could adversely affect our business, cash flows, financial condition and results of operations.
In addition, factors such as business consolidations and strategic alliances will likely continue to create pressure to contain or otherwise restrict price increases for products and services, despite increasing medical costs. Continuing consolidation among physicians, hospitals and other health care providers, the emergence of accountable care organizations, vertical integration of health care providers and other entities, changes in the organizational structures chosen by physicians, hospitals and health care providers, new market entrants, including those not traditionally in the health care industry, and the ability of larger employers to contract directly with providers may impact how we compete and the way we price our products. Technological advancements, such as those that allow customers and providers to access medical information remotely and telemedicine, may also affect how we compete and price our products. Our product margins and growth depend, in part, on our ability to compete effectively in our markets, set prices appropriately in highly competitive markets to keep or increase our market share, increase customers as planned, and avoid losing accounts with favorable medical cost experience while retaining or increasing our customer base in accounts with unfavorable medical cost experience.
Premiums in the health care business are generally set for one-year periods and are priced well in advance of the date on which the contract commences. Our revenue on Medicare policies is based on bids submitted mid-year in the year before the contract year. Although we base the premiums we charge and our Medicare bids on our estimate of future health care costs over the contract period, actual costs may exceed what we estimate and charge in premiums due to factors such as medical cost inflation, higher than expected utilization of medical services, new or costly drugs, treatments and technology and customer mix. Our health care costs also are affected by external events that we cannot forecast or project and over which we have little or no control, such as influenza-related health care costs, epidemics, pandemics, terrorist attacks or other man-made disasters, natural disasters or other events that materially increase utilization of medical and/or other covered services, as well as changes in customers' health care utilization patterns and provider billing practices. Relatively small differences between predicted and actual medical costs or utilization rates as a percentage of revenue can result in significant changes in our financial results. Our profitability depends, in part, on our ability to accurately predict, price for and effectively manage future health care costs through disciplined underwriting, provider contracting, utilization management and product design.
The reserves we hold for expected medical claims are based on estimates that involve an extensive degree of judgment and are inherently variable. If actual claims exceed our estimates, our operating results could be materially adversely affected, and our ability to take timely corrective actions to contain future costs may be limited.
We maintain and record medical claims reserves on our balance sheet for estimated future payments. Our estimates of health care costs payable are based on a number of factors, including historical claim experience, but this estimation process requires extensive judgment. Considerable variability is inherent in such estimates, and the accuracy of the estimates is highly sensitive to changes in medical claims submission and processing patterns and/or procedures, changes in customer base and product mix, changes in the utilization of medical and/or other covered services, changes in medical cost trends, changes in our medical management practices and the introduction of new benefits and products. Furthermore, if we are not able to accurately and promptly anticipate and detect medical cost trends, our ability to take timely corrective actions to limit future costs and reflect our current benefit cost experience in our pricing process may be limited. In addition, while we continually review estimates of future payments relating to medical claims costs for services incurred in the current and prior periods and make adjustments to our reserves, the actual health care costs may exceed the reserves we have recorded.
If we fail to develop and maintain satisfactory relationships with physicians, hospitals and other health care providers, our business and results of operations may be adversely affected.
We directly and indirectly contract with physicians, hospitals and other health care professionals and facilities to provide health care services to our customers. Our results of operations are substantially dependent on our ability to contract for these services at competitive prices. In any particular market, physicians, hospitals and health care providers may enter into exclusive arrangements with competitors or simply refuse to contract with us, demand higher payments or take other actions that could result in higher medical costs or less desirable products for our customers. In some markets, certain providers, particularly hospitals, physician/hospital organizations and multi-specialty physician groups, may have significant or controlling market positions that could result in a diminished bargaining position for us. If providers refuse to contract with us, use their market position to negotiate more favorable contracts or place us at a competitive disadvantage, our ability to market products or to be profitable in those areas could be materially and adversely affected. Establishing collaborative arrangements with physician groups, specialist groups, independent practice associations, hospitals and health care delivery systems is key to our strategic focus to transition from volume-based fee-for-service arrangements to a value-based health care system. If such collaborative arrangements do not result in the lower medical costs that we project or if we fail to attract health care providers to such arrangements, or are less successful at implementing such arrangements than our competitors, our attractiveness to customers may be reduced and our ability to profitably grow our business may be adversely affected.
Our ability to develop and maintain satisfactory relationships with health care providers also may be negatively impacted by other factors not associated with us, such as changes in Medicare and/or Medicaid reimbursement levels, increasing pressure on revenue and other pressures on health care providers and increasing consolidation activity among hospitals, physician groups and health care providers. For example, ongoing reductions by CMS and state governments in amounts payable to providers, particularly hospitals, for services provided to Medicare and Medicaid enrollees may exacerbate the cost shift to private payors, thereby adversely impacting our ability to maintain or develop new cost-effective health care provider contracts or result in a loss of revenues or customers.
Continuing consolidation among physicians, hospitals and other health care providers, the emergence of accountable care organizations, vertical integration of health care providers and other entities, changes in the organizational structures chosen by physicians, hospitals and health care providers and new market entrants, including those not traditionally in the health care industry, may affect the way providers interact with us and may change the competitive landscape in which we operate. In some instances, these organizations may compete directly
| 22 CIGNA CORPORATION - 2017 Form 10-K | | |
PART I
ITEM 1A. Risk Factors
with us, potentially affecting the way that we price our products and services or cause us to incur increased costs if we change our operations to be more competitive.
Out-of-network providers are not limited by any agreement with us in the amounts they bill. While benefit plans place limits on the amount of charges that will be considered for reimbursement, out-of-network providers have become increasingly sophisticated and aggressive and such limitations can be difficult to enforce. As a result, the outcome of disputes where we do not have a provider contract may cause us to pay higher medical or other benefit costs than we projected.
As a global company, we face political, legal, operational, regulatory, economic and other risks that present challenges and could negatively affect our multinational operations and/or our long-term growth.
As a global company, our business is increasingly exposed to risks inherent in foreign operations. These risks can vary substantially by market, and include political, legal, operational, regulatory, economic and other risks, including government intervention that we do not face in our U.S. operations. The global nature of our business and operations may present challenges including, but not limited to, those arising from:
These factors may increase in significance as we continue to expand globally, and any one of these challenges could negatively affect our operations or long-term growth. For example, due to the concentration of our international business in South Korea, the Global Supplemental Benefits segment is exposed to potential losses resulting from economic and regulatory changes in that country and the geopolitical climate in the Korean Peninsula, as well as foreign currency movements affecting the South Korean currency, that could have a significant impact on the segment's results and our consolidated financial results.
International operations also require us to devote significant resources to implement controls and systems in new markets to comply with, and to ensure that our vendors and partners comply with, U.S. and foreign laws prohibiting bribery, corruption and money laundering, in addition to other regulations regarding, among other things, our products, direct-to-consumer communications, customer privacy, data protection and data residency. Violations of these laws and regulations could result in fines, criminal sanctions against us, our officers or employees, restrictions or outright prohibitions on the conduct of our business and significant reputational harm. We must regularly reassess the size, capability and location of our global infrastructure and make appropriate changes, and must have effective change management processes and internal controls in place to address changes in our business and operations. Our success depends, in part, on our ability to anticipate these risks and manage these challenges. Our failure to comply with laws and regulations governing our conduct outside the United States or to establish constructive relations with non-U.S. regulators could have a material adverse effect on our business, results of operations, financial condition, liquidity and long-term growth.
We are dependent on the success of our relationships with third parties for various services and functions, including, but not limited to, certain pharmacy benefit management services.
To improve operating costs, productivity and efficiencies, we contract with third parties for the provision of specific services, such as certain pharmacy benefit management services, information technology, medical management services, call center and claim services. Our operations may be adversely affected if a third party fails to satisfy its obligations to us or if the arrangement is terminated in whole or in part or if there is a contractual dispute between us and the third party. Even though contracts are intended to provide certain protections, we have limited control
| | | CIGNA CORPORATION - 2017 Form 10-K 23 |
PART I
ITEM 1A. Risk Factors
over the actions of third parties. For example, noncompliance with any privacy or security laws and regulations or any security breach involving one of our third-party vendors or a dispute between us and a third party vendor related to our arrangement could have a material adverse effect on our business, results of operations, financial condition, liquidity and reputation. In addition, with respect to services or functions outsourced to third parties in foreign jurisdictions, we also are exposed to risks inherent in conducting business outside of the United States.
Outsourcing also may require us to change our existing operations, adopt new processes for managing these service providers and/or redistribute responsibilities to realize the potential productivity and operational efficiencies. If there are delays or difficulties in changing business processes or our third party vendors do not perform as expected, we may not realize, or not realize on a timely basis, the anticipated economic and other benefits of these relationships. This could result in substantial costs or regulatory compliance issues, divert management's attention from other strategic activities, negatively affect employee morale or create other operational or financial problems for us. Terminating or transitioning in whole or in part arrangements with key vendors could result in additional costs or penalties, risks of operational delays or potential errors and control issues during the termination or transition phase. We may not be able to find an alternative vendor in a timely manner or on acceptable terms. If there is an interruption in business or loss of access to data resulting from a termination or transition in services, we may not be able to meet the demands of our customers and, in turn, our business and results of operations could be adversely impacted.
Acquisitions, joint ventures and other transactions involve risks and we may not realize the expected benefits because of integration difficulties, underperformance relative to our expectations and other challenges.
As part of our growth strategy, we regularly consider and enter into strategic transactions, including mergers, acquisitions, joint ventures, licensing arrangements and other relationships (collectively referred to as "transactions"), with the expectation that these transactions will result in various benefits. Our ability to achieve the anticipated benefits of these transactions is subject to numerous uncertainties and risks, including our ability to integrate operations, resources and systems, including data security systems, in an efficient and effective manner. We could also face challenges in implementing business plans; changes in laws and regulations or conditions imposed by regulations applicable to the business; retaining key employees; and general competitive factors in the marketplace. These events could result in increased costs, decreases in expected revenues, earnings or cash flow, and goodwill or other intangible asset impairment charges. Further, we may finance transactions by issuing common stock for some or all of the purchase price that could dilute the ownership interests of our shareholders, or by incurring additional debt that could impact our ability to access capital in the future.
In addition, effective internal controls are necessary to provide reliable and accurate financial reports and to mitigate the risk of fraud. The integration of businesses is likely to cause increasing complexity in our systems and internal controls and make them more difficult to manage. Any difficulties in assimilating businesses into our control system could cause us to fail to meet our financial reporting obligations. Ineffective internal controls also could cause investors to lose confidence in our reported financial information that could negatively impact the trading price of our stock and our access to capital.
Our business depends on our ability to effectively invest in, implement improvements to and properly maintain the uninterrupted operation and data integrity of our information technology and other business systems.
Our business is highly dependent on maintaining effective information systems as well as the integrity and timeliness of the data we use to serve our customers and health care professionals and to operate our business. If our data were found to be inaccurate or unreliable due to fraud or other error, or if we, or any of the third-party service providers we engage, were to fail to maintain information systems and data integrity effectively, we could experience operational disruptions that may impact our clients, customers and health care professionals and hinder our ability to establish appropriate pricing for products and services, retain and attract clients and customers, establish reserves and report financial results timely and accurately and maintain regulatory compliance, among other things.
Our information technology strategy and execution are critical to our continued success. Increasing regulatory and legislative changes will place additional demands on our information technology infrastructure that could have a direct impact on resources available for other projects tied to our strategic initiatives. In addition, recent trends toward greater consumer engagement in health care require new and enhanced technologies, including more sophisticated applications for mobile devices. We must continue to invest in long-term solutions that will enable us to anticipate customer needs and expectations, enhance the customer experience, act as a differentiator in the market and protect against cybersecurity risks and threats. Our success is dependent, in large part, on maintaining the effectiveness of existing technology systems and continuing to deliver and enhance technology systems that support our business processes in a cost-efficient and resource-efficient manner. Connectivity among technologies is becoming increasingly important. The failure of our health care technologies to operate seamlessly with other products could adversely affect our results of operations, financial position and cash flows. We must also develop new systems to meet current market standards and keep pace with continuing changes in information processing technology, evolving industry and regulatory standards and customer needs. Failure to do so may present compliance challenges and impede our ability to deliver services in a competitive manner. Further, because system development projects are long-term in nature, they may be more costly than expected to complete and may not deliver the expected benefits upon completion.
In addition, our business is highly dependent upon our ability to perform, in an efficient and uninterrupted fashion, necessary business functions, such as claims processing and payment, internet support and customer call centers, and processing new and renewal business. Unavailability, cyber-attack or other failure of one or more of our information technology or other systems could cause slower response times, resulting in claims not being processed as quickly as clients or customers desire, decreased levels of client or customer service and satisfaction, and harm to our reputation. Because our information technology and other systems interface with and depend on third-party systems, we could experience service denials if demand for such service exceeds capacity or a third-party system fails or experiences an interruption. If sustained or repeated, such business interruptions, systems failures or service denials could have material adverse effects on our business, results of operations, financial condition and liquidity.
| 24 CIGNA CORPORATION - 2017 Form 10-K | | |
PART I
ITEM 1A. Risk Factors
As a large health services company, we are subject to cyber-attacks or other privacy or data security incidents. If we are unable to prevent or contain the effects of any such attacks, we may suffer exposure to substantial liability, reputational harm, loss of revenue or other damages.
Our business depends on our clients' and customers' willingness to entrust us with their health-related and other sensitive personal information. Computer systems may be vulnerable to physical break-ins, computer viruses or malware, programming errors, attacks by third parties or similar disruptive problems. We have been, and will likely continue to be, the target of computer viruses or other malicious codes, unauthorized access, cyber-attacks or other computer-related penetrations. There have been large scale cyber-attacks within the health care industry. As we increase the amount of personal information that we store and share digitally, our exposure to data security and related cybersecurity risks increases, including the risk of undetected attacks, damage, loss or unauthorized access or misappropriation of proprietary or personal information, and the cost of attempting to protect against these risks also increases. We have implemented security technologies, processes and procedures to protect consumer identity and provide employee awareness training around phishing, malware and other cyber risks; however, there are no assurances that such measures will be effective against all types of breaches. The techniques used change frequently or are often not recognized until after they have been launched, because cyber-attacks can originate from a wide variety of sources including third parties such as external service providers. Those parties may also attempt to fraudulently induce employees, customers or other users of our systems to disclose sensitive information in order to gain access to our data or that of our customers. In addition, while we have certain standards for all vendors that provide us services, our vendors, and in turn, their own service providers, may become subject to the same type of security breaches. Finally, our offices may be vulnerable to security incidents or security attacks, acts of vandalism or theft, misplaced or lost data, human error or similar events that could negatively affect our systems and our customers' and clients' data.
The costs to eliminate or address security threats and vulnerabilities before or after a cyber-incident could be significant. Our remediation efforts may not be successful and could result in interruptions, delays, or cessation of service and loss of existing or potential customers.
In addition, breaches of our security measures and the unauthorized dissemination of sensitive personal information or proprietary information or confidential information about us, our customers or other third-parties could expose our customers' private information and our customers to the risk of financial or medical identity theft. Unauthorized dissemination of confidential and proprietary information about our business and strategy also could negatively affect the achievement of our strategic initiatives. Such events would also negatively affect our ability to compete, others' trust in us, our reputation, customer base and revenues and expose us to mandatory disclosure (including to the media), litigation and other enforcement proceedings, material fines, penalties and/or remediation costs, and compensatory, special, punitive and statutory damages, consent orders and other adverse actions, any of which could adversely affect our business, results of operations, financial condition or liquidity.
Our pharmacy benefit management business and related operations are subject to a number of risks and uncertainties that are in addition to those we face in our health care business.
Notwithstanding our arrangement with a third-party vendor for certain pharmacy benefit management services, we remain responsible to regulators and our clients and customers for the delivery of those pharmacy benefit management services that we contract to provide. Our pharmacy benefit management business is subject to federal and state regulation, including without limitation, federal and state anti-kickback laws, consumer protection laws, ERISA, HIPAA and laws related to the operation of Internet and mail-service pharmacies, as well as the laws and regulations of the foreign countries in which we conduct business. In addition, certain of our subsidiaries are pharmacies subject to state licensing and U.S. Drug Enforcement Agency registration requirements and state and federal laws concerning labeling, packaging, advertising, handling and adulteration of prescription drugs and dispensing of controlled substances. Noncompliance with applicable regulations by us or our third-party vendors could have material adverse effects on our business, results of operations, financial condition, liquidity and reputation.
Our pharmacy benefit management business also would be adversely affected by an inability to contract on favorable terms with pharmaceutical manufacturers and we could suffer exposure to liabilities and reputational harm in connection with purported errors by mail order or retail pharmacy businesses.
In operating onsite clinics and other types of medical facilities, we may be subject to additional liability that could result in significant time and expense.
In addition to contracting with physicians and other health care providers for services, we employ physicians and other health care professionals at onsite low acuity and primary care clinics that we operate for our customers, as well as certain clinics for our employees. In addition, our Government business operates LivingWell health centers and we own and operate multispecialty health care centers, low acuity clinics and other types of centers in the Phoenix, Arizona metropolitan area that employ physicians and other health care professionals. As a direct employer of health care professionals and as an owner or operator of medical facilities, we are subject to liability for negligent acts, omissions, or injuries occurring at one of these clinics or caused by one of our employees. Even if any claims brought against us are unsuccessful or without merit, we still have to defend against such claims. The defense of any actions may result in significant expenses that could have a material adverse effect on our business, results of operations, financial condition, liquidity and reputation.
Legal and Compliance Risks |
Our business is subject to substantial government regulation, as well as new laws or regulations or changes in existing laws or regulations that could have a material adverse effect on our business, results of operations, financial condition and liquidity.
Our business is regulated at the federal, state, local and international levels. The laws and rules governing our business and related interpretations, including, among others, those associated with the ACA, are increasing in number and complexity, are subject to frequent change and can be inconsistent or in conflict with each other. As a public company with global operations, we are subject to the laws of multiple
| | | CIGNA CORPORATION - 2017 Form 10-K 25 |
PART I
ITEM 1A. Risk Factors
jurisdictions and the rules and regulations of various governing bodies, such as those related to financial and other disclosures, corporate governance, privacy, data protection, labor and employment, consumer protection, tax and anti-corruption.
We must identify, assess and respond to new trends in the legislative and regulatory environment, as well as comply with the various existing regulations applicable to our business. Existing or future laws, rules, regulatory interpretations or judgments could force us to change how we conduct our business, affect the products we offer, restrict revenue and enrollment growth, increase our costs, including operating, health care technology and administrative costs, and require enhancements to our compliance infrastructure and internal controls environment. Existing or future laws and rules also could require us to take other actions such as changing our business practices, thereby increasing our liability in federal and state courts for coverage determinations, contract interpretation and other actions.
Several bills were introduced in Congress in 2017 to repeal and replace the ACA, though none have passed the House and Senate. Discussions on the ACA continue in Congress. Throughout 2017, President Trump took several steps to limit the utility of the ACA and continues to advocate for its repeal and replacement. The individual mandate was repealed effective January 1, 2019 as part of the U.S. tax reform legislation that was signed into law in December 2017. We are unable to predict how these events will ultimately be resolved and what the potential impact may be on the ACA, and in turn, on our business including, but not limited to, our products, services, processes and technology and on our relationships with current and future customers, producers, vendors and health care providers. Legal challenges regarding aspects of the ACA, such as litigation regarding the payment of risk corridor receivables and cost sharing reduction subsidies, have contributed to this uncertainty. In addition, state legislatures have and will continue to focus on health care issues, particularly in light of the various ACA amendments proposed by Congress and the Trump administration executive orders.
Further, failure to effectively implement or adjust our strategic and operational initiatives, such as by reducing operating costs, adjusting premium pricing or benefit design or transforming our business model in response to regulatory changes may have a material adverse effect on our results of operations, financial condition and cash flows, including, but not limited to, our ability to maintain the value of our goodwill and other intangible assets.
Our insurance and HMO subsidiaries must be licensed by and are subject to the regulations of the jurisdictions in which they conduct business. For example, HMOs and insurance companies are regulated under specific state laws and regulations and indirectly affected by other health care-related laws and regulations. State regulations mandate minimum capital or restricted cash reserve requirements. In addition, state guaranty fund laws and related regulations subject us to assessments for certain obligations to policyholders and claimants of impaired or insolvent insurance companies. Some states have similar laws relating to HMOs and other payors, such as consumer operated and oriented plans (co-ops) established under the ACA. Any such assessment could expose us to the risk of paying a portion of an impaired or insolvent insurance company's claims through state guaranty association assessments. We also participate in the private exchange marketplace. Whether and the extent to which states may issue regulations that apply to private exchanges remains uncertain.
In addition to the regulations discussed above, we are required to obtain and maintain insurance and other regulatory approvals to market many of our products, increase prices for certain regulated products and consummate some of our acquisitions and dispositions. Delays in obtaining or failure to obtain or maintain these approvals could reduce our revenue or increase our costs.
The health care industry is also regularly subject to negative media attention, including as a result of the political environment and the ongoing debate concerning the ACA. Such publicity may adversely affect our stock price and reputation in certain markets.
For more information on regulation, see "Business – Regulation" in Part I, Item 1 of this Form 10-K.
There are various risks associated with participating in government-sponsored programs, such as Medicare, including dependence upon government funding, compliance with government contracts and increased regulatory oversight.
Through our Government business, we contract with CMS and various state governmental agencies to provide managed health care services including Medicare Advantage plans and Medicare-approved prescription drug plans. Revenues from Medicare programs are dependent, in whole or in part, upon annual funding from the federal government through CMS and/or applicable state or local governments. Funding for these programs is dependent on many factors outside our control including general economic conditions, continuing government efforts to contain health care costs and budgetary constraints at the federal or applicable state or local level and general political issues and priorities. These entities generally have the right to not renew or cancel their contracts with us on short notice without cause or if funds are not available. Unanticipated changes in funding, such as the application of sequestration by the federal or state governments, could substantially reduce our revenues and profitability.
The Medicare program has been the subject of regulatory reform initiatives, including the ACA. The premium rates paid to Medicare Advantage plans and Medicare Part D plans are established by contract, although the rates differ depending on a combination of factors, many of which are outside our control. The ACA ties a portion of each Medicare Advantage plan's and Medicare Part D plan's reimbursement to the plan's "Star Rating" by CMS, with those plans receiving a rating of four or more stars eligible for quality-based bonus payments. The Star Rating system considers various measures adopted by CMS, including, for example, quality of care, preventative services, chronic illness management, coverage determination appeals and customer satisfaction. The Star Rating system is subject to change annually by CMS, which may make it more difficult to achieve four stars or greater. Our Medicare Advantage plans' and Medicare Part D plans' operating results, premium revenue and benefit offerings are likely to continue to be significantly determined by their Star Ratings. If we fail to meet our expectations regarding Star Ratings, are unsuccessful in maintaining or improving our Star Ratings, fail to meet or exceed our competitors' ratings, or if quality-bonus payments are eliminated, our financial performance may be adversely affected. See Part II, Item 7 – Management's Discussion and Analysis of Financial Condition and Results of Information – Health Care Industry Developments and Other Matters Affecting our Global Health Care Segment for additional information on our Star Ratings.
Contracts with CMS and the various state governmental agencies contain certain provisions regarding data submission, provider network maintenance, provider directories, quality measures, claims payment, continuity of care, call center performance and other requirements. If we fail to comply with these requirements, we may be subject to administrative actions, fines or other penalties that could impact our profitability.
| 26 CIGNA CORPORATION - 2017 Form 10-K | | |
PART I
ITEM 1A. Risk Factors
The ACA established health insurance exchanges for individuals and small employers. Insurers participating on the health insurance exchanges are required to offer a minimum level of benefits and comply with requirements with respect to premium rates and coverage limitations. Our participation in these exchanges involves uncertainties associated with mix and volume of business and could adversely affect our results of operations, financial position and cash flows. The executive order signed by President Trump in October 2017 that halted payment of the cost sharing reduction subsidies has created additional uncertainty regarding the future of public health insurance exchanges.
In addition, any failure to comply with various state and federal health care laws and regulations, including those directed at preventing fraud and abuse in government funded programs, could result in investigations or litigation, such as actions under the federal False Claims Act and similar whistleblower statutes under state laws. This could subject us to fines, penalties or other enforcement actions, restrictions on our ability to market or enroll new customers, limits on expansion, restrictions or exclusions from programs or other agreements with federal or state governmental agencies that could adversely impact our business, cash flows, financial condition, results of operations and reputation.
In addition, our Medicare Advantage and Medicare Part D businesses face a number of other risks including potential uncollectible receivables resulting from processing and/or verifying enrollment, inadequate underwriting assumptions, inability to receive and process correct information or increased medical or pharmaceutical costs. Actual results may be materially different than our assumptions and estimates regarding these complex and wide-ranging programs that could have a material adverse effect on our business, financial condition and results of operations.
We face risks related to litigation, regulatory audits and investigations.
We are routinely involved in numerous claims, lawsuits, regulatory audits, investigations and other legal matters arising, for the most part, in the ordinary course of business, including that of administering and insuring employee benefit programs. These legal matters could include benefit claims, breach of contract actions, tort claims, claims arising from consumer protection laws, claims disputes under federal or state laws and disputes regarding reinsurance arrangements, employment and employment discrimination-related suits, antitrust claims, employee benefit claims, wage and hour claims, tax, privacy, intellectual property and whistle blower claims, shareholder suits and other securities law claims and real estate disputes. In addition, we have incurred and likely will continue to incur liability for practices and claims related to our health care business, such as marketing misconduct, failure to timely or appropriately pay for or provide health care, provider network structure, poor outcomes for care delivered or arranged, provider disputes including disputes over compensation or contractual provisions, and claims related to our administration of self-funded business. There are currently, and may be in the future, attempts to bring class action lawsuits against the company and the industry; individual plaintiffs also may bring multiple claims regarding the same subject matter against us and other companies in our industry.
With respect to our global operations, contractual rights, tax positions, laws and regulations may be subject to interpretation or uncertainty to a greater degree than in the United States, and therefore subject us to disputes by customers, governmental authorities or others. Foreign laws and rules and regulatory audit and investigative practices may differ from or be more stringent than, similar requirements in the United States.
Court decisions and legislative activity may increase our exposure for any of these types of claims. In some cases, substantial non-economic or punitive damages may be sought. We seek to procure insurance coverage to cover some of these potential liabilities. However, certain potential liabilities may not be covered by insurance, insurers may dispute coverage or the amount of insurance may be insufficient to cover the entire damages awarded. In addition, certain types of damages, such as punitive damages, may not be covered by insurance, and insurance coverage for all or certain forms of liability may become unavailable or prohibitively expensive in the future. It is possible that the resolution of current or future legal matters and claims could result in changes to our industry and business practices, losses material to our results of operations, financial condition and liquidity or damage to our reputation.
We are frequently the subject of regulatory market conduct and other reviews, audits and investigations by state insurance and health and welfare departments, attorneys general, CMS and the OIG and comparable authorities in foreign jurisdictions. With respect to our Medicare Advantage and Medicare Part D businesses, CMS and OIG perform audits to determine a health plan's compliance with federal regulations and contractual obligations, including compliance with proper coding practices and fraud and abuse enforcement practices through audits designed to detect and correct improper payments. The Department of Justice is conducting an industry review of the risk adjustment data submission practices and business processes, including review of medical charts, of Medicare Advantage organizations under Medicare Parts C and D. There also continues to be heightened review by federal and state regulators of business and reporting practices within the health care, disability and life insurance industry, including with respect to claims payment and related escheat practices, and increased scrutiny by other state and federal governmental agencies (such as state attorneys general) empowered to bring criminal actions in circumstances that could have previously given rise only to civil or administrative proceedings. These regulatory audits or reviews or actions by other governmental agencies could result in changes to our business practices, retroactive adjustments to certain premiums, significant fines, penalties, civil liabilities, criminal liabilities or other sanctions, including restrictions on our ability to market certain products or engage in business-related activities, that could have a material adverse effect on our business, results of operation, financial condition and liquidity. In addition, disclosure of an adverse investigation or audit or the imposition of fines or other sanctions could negatively affect our reputation in certain markets and make it more difficult for us to sell our products and services.
A description of material pending legal actions and other legal and regulatory matters is included in Note 21 to our Consolidated Financial Statements included in this Form 10-K. The outcome of litigation and other legal or regulatory matters is always uncertain.
If we fail to comply with applicable privacy, security and data laws, regulations and standards, our business and reputation could be materially and adversely affected.
The collection, maintenance, protection, use, transmission, disclosure and disposal of sensitive personal information are regulated at the federal, state, international and industry levels and requirements are imposed on us by contracts with clients. In some cases, such laws, rules, regulations and contractual requirements also apply to our vendors and require us to obtain written assurances of their compliance with such requirements or may hold us liable for any violations by our vendors. International laws, rules and regulations governing the use and disclosure of such information are generally more stringent than in the United States, and they vary across jurisdictions. We also are subject to various other consumer protection laws that regulate our communications with customers.
| | | CIGNA CORPORATION - 2017 Form 10-K 27 |
PART I
ITEM 1A. Risk Factors
These laws, rules, and contractual requirements are subject to change. Compliance with new privacy, security and data laws, regulations and requirements may result in increased operating costs, and may constrain or require us to alter our business model or operations. For example, the HITECH amendments to HIPAA may further restrict our ability to collect, disclose and use sensitive personal information and may impose additional compliance requirements on our business.
HIPAA requires covered entities to comply with the HIPAA privacy, security and breach rules. In addition, business associates must comply with the HIPAA security and breach requirements. While we provide for appropriate protections through our contracts with our third-party service providers and in certain cases assess their security controls, we have limited oversight or control over their actions and practices. Several of our businesses act as business associates to their covered entity customers and, as a result, collect, use, disclose and maintain sensitive personal information in order to provide services to these customers. HHS has continued its audit program to assess HIPAA compliance efforts by covered entities and has expanded it to include business associates. In addition, HHS has increased its enforcement efforts. These efforts result in enforcement actions that are the result of investigations brought on by the notification to HHS of a breach. An audit resulting in findings or allegations of noncompliance or the implementation of an enforcement action could have an adverse effect on our results of operations, financial position, cash flows and reputation.
Effective prevention, detection and control systems are critical to maintain regulatory compliance and prevent fraud and failure of these systems could adversely affect us.
Federal and state governments have made investigating and prosecuting health care and other insurance fraud and abuse a priority. Fraud and abuse prohibitions encompass a wide range of activities including kickbacks for referral of customers, billing for unnecessary medical services, improper marketing and violations of patient privacy rights. The regulations and contractual requirements applicable to us are complex and subject to change. In addition, ongoing vigorous law enforcement, a highly technical regulatory scheme and the Dodd-Frank Act legislation and related regulations enhance regulators' enforcement powers and whistleblower incentives and protections. Our compliance efforts in this area will continue to require significant resources. Failure of our prevention, detection or control systems related to regulatory compliance or the failure of employees to comply with our internal policies including data systems security or unethical conduct by managers and employees, could adversely affect our reputation and also expose us to litigation and other proceedings, fines and penalties.
In addition, provider or customer fraud that is not prevented or detected could impact our medical costs or those of our self-insured clients. Further, during an economic downturn, we may experience increased fraudulent claims volume that may lead to additional costs due to an increase in disputed claims and litigation.
Economic Risks |
Significant stock market or interest rate declines could result in additional unfunded pension obligations resulting in the need for additional plan funding by us and increased pension expenses.
We currently have unfunded obligations in our frozen pension plans. A significant decline in the value of the plans' equity and fixed income investments or unfavorable changes in applicable laws or regulations could materially increase our expenses and change the timing and amount of required plan funding. This could reduce the cash available to us, including our subsidiaries. We also are exposed to interest rate and equity risk associated with our pension and other post-retirement obligations. Sustained declines in interest rates could have an adverse impact on the funded status of our pension plans and our reinvestment yield on new investments. See Note 15 to our Consolidated Financial Statements for more information on our obligations under the pension plan.
Significant changes in market interest rates affect the value of our financial instruments that promise a fixed return or benefit and the value of particular assets and liabilities.
As an insurer, we have substantial investment assets that support insurance and contractholder deposit liabilities. Generally low levels of interest rates on investments, such as those experienced in U.S. and foreign financial markets during recent years, have negatively impacted our level of investment income earned in recent periods.
A substantial portion of our investment assets are in fixed interest-yielding debt securities of varying maturities, fixed redeemable preferred securities and commercial mortgage loans. The value of these investment assets can fluctuate significantly with changes in market conditions. A rise in interest rates would likely reduce the value of our investment portfolio and increase interest expense if we were to access our available lines of credit.
A downgrade in the financial strength ratings of our insurance subsidiaries could adversely affect new sales and retention of current business, and a downgrade in our debt ratings would increase the cost of borrowed funds and could negatively affect our ability to access capital.
Financial strength, claims paying ability and debt ratings by recognized rating organizations are each important factors in establishing the competitive position of insurance and health benefits companies. Ratings information by nationally recognized ratings agencies is broadly disseminated and generally used throughout the industry. We believe that the claims paying ability and financial strength ratings of our principal insurance subsidiaries are important factors in marketing our products to certain customers. Our debt ratings impact both the cost and availability of future borrowings and, accordingly, our cost of capital. Each of the rating agencies reviews ratings periodically and there can be no assurance that current ratings will be maintained in the future. A downgrade of these ratings in the future could make it more difficult to either market our products successfully or raise capital to support business growth within our insurance subsidiaries.
| 28 CIGNA CORPORATION - 2017 Form 10-K | | |
PART I
ITEM 1A. Risk Factors
Global market, economic and geopolitical conditions may cause fluctuations in equity market prices, interest rates and credit spreads that could impact our ability to raise or deploy capital and affect our overall liquidity.
If the equity and credit markets experience extreme volatility and disruption, there could be downward pressure on stock prices and access to capital for certain issuers without regard to those issuers' underlying financial strength. Extreme disruption in the credit markets could adversely impact our availability and cost of capital in the future.
As of December 31, 2017, our outstanding long-term debt totaled $5.2 billion. In the event of adverse economic and industry conditions, we may be required to dedicate a greater percentage of our cash flow from operations to the payment of principal and interest on our debt, thereby reducing the funds we have available for other purposes, such as investments and other expenditures in ongoing businesses, acquisitions, dividends and stock repurchases. In these circumstances, our ability to execute our strategy may be limited, our flexibility in planning for or reacting to changes in business and market conditions may be reduced, or our access to capital markets may be limited such that additional capital may not be available or may be available only on unfavorable terms.
Unfavorable developments in economic conditions may adversely affect our business, results of operations and financial condition.
Many factors, including geopolitical issues, future economic downturns, availability and cost of credit and other capital and consumer spending can negatively impact the U.S. and global economies. Our results of operations could be materially and adversely affected by the impact of unfavorable economic conditions on our customers (both employers and individuals), health care providers and third-party vendors. For example:
These factors could lead to a decrease in our customer base, revenues or margins and/or an increase in our operating costs.
In addition, during a prolonged unfavorable economic environment, state and federal budgets could be materially and adversely affected, resulting in reduced or delayed reimbursements or payments in state and federal government programs such as Medicare and Social Security. These state and federal budgetary pressures also could cause the government to impose new or a higher level of taxes or assessments on us, such as premium taxes on insurance companies and HMOs and surcharges or fees on select fee-for-service and capitated medical claims. Although we could attempt to mitigate or cover our exposure from such increased costs through, among other things, increases in premiums, there can be no assurance that we will be able to mitigate or cover all of such costs, which may have a material adverse effect on our business, results of operations, financial condition and liquidity.
We are subject to the credit risk of our reinsurers.
We enter into reinsurance arrangements with other insurance companies, primarily to limit losses from large exposures or to permit recovery of a portion of direct losses. We also may enter into reinsurance arrangements in connection with acquisition or divestiture transactions when the underwriting company is not being acquired or sold.
Under all reinsurance arrangements, reinsurers assume insured losses, subject to certain limitations or exceptions that may include a loss limit. These arrangements also subject us to various obligations, representations and warranties with the reinsurers. Reinsurance does not relieve us of liability as the originating insurer. We remain liable to the underlying policyholders if a reinsurer defaults on obligations under the reinsurance arrangement. Although we regularly evaluate the financial condition of reinsurers to minimize exposure to significant losses from reinsurer insolvencies, reinsurers may become financially unsound. If a reinsurer fails to meet its obligations under the reinsurance contract or if the liabilities exceed any applicable loss limit, we will be forced to cover the claims on the reinsured policies.
The collectability of amounts due from reinsurers is subject to uncertainty arising from a number of factors, including whether the insured losses meet the qualifying conditions of the reinsurance contract, whether reinsurers or their affiliates have the financial capacity and willingness to make payments under the terms of the reinsurance contract, and the magnitude and type of collateral supporting our reinsurance recoverable, such as holding sufficient qualifying assets in trusts or letters of credit issued. Although a portion of our reinsurance exposures are secured, the inability to collect a material recovery from a reinsurer could have a material adverse effect on our results of operations, financial condition and liquidity.
| | | CIGNA CORPORATION - 2017 Form 10-K 29 |
PART I
ITEM 1B. Unresolved Staff Comments
ITEM 1B. Unresolved Staff Comments |
None.
ITEM 2. Properties |
Our global real estate portfolio consists of approximately 7.9 million square feet of owned and leased properties. Our domestic portfolio has approximately 5.7 million square feet in 38 states, the District of Columbia, Puerto Rico and the U.S. Virgin Islands. Our international properties contain approximately 2.2 million square feet located throughout the following countries: Belgium, Canada, China, Hong Kong, India, Indonesia, Kenya, New Zealand, Singapore, South Korea, Spain, Switzerland, Taiwan, Thailand, Turkey, United Arab Emirates, and the United Kingdom.
Our principal domestic office locations include the Wilde Building located at 900 Cottage Grove Road in Bloomfield, Connecticut (our corporate headquarters) and Two Liberty Place located at 1601 Chestnut Street in Philadelphia, Pennsylvania. The Wilde Building measures approximately 893,000 square feet and is owned, while Two Liberty Place measures approximately 322,000 square feet and is leased space.
We believe our properties are adequate and suitable for our business as presently conducted. The foregoing does not include information on investment properties.
ITEM 3. Legal Proceedings |
The information contained under "Litigation Matters", "Regulatory Matters" and "Other Legal Matters" in Note 21 to our Financial Statements beginning on page 102 of this Form 10-K, is incorporated herein by reference.
ITEM 4. Mine Safety Disclosures |
Not applicable.
| 30 CIGNA CORPORATION - 2017 Form 10-K | | |
PART I
EXECUTIVE OFFICERS OF THE REGISTRANT
EXECUTIVE OFFICERS OF THE REGISTRANT |
All officers are elected to serve for a one-year term or until their successors are elected. Principal occupations and employment during the past five years are listed below.
LISA R. BACUS, 53, Executive Vice President and Global Chief Marketing Officer of Cigna beginning May 2013 and Chief Customer Officer beginning February 2017; Executive Vice President and Chief Marketer at American Family Insurance from February 2008 until May 2013.
MARK L. BOXER, 58, Executive Vice President and Global Chief Information Officer of Cigna beginning April 2011; Deputy Chief Information Officer, Xerox Corporation; and Group President, Government Health Care, for Xerox Corporation/Affiliated Computer Services from March 2009 until April 2011.
DAVID M. CORDANI, 52, Chief Executive Officer of Cigna beginning December 2009; Director since October 2009; President beginning June 2008; and Chief Operating Officer from June 2008 until December 2009.
BRIAN C. EVANKO, 41, President, Government Business beginning November 2017; President, U.S. Individual Business from August 2013 to November 2017; Business Financial Officer, Cigna Global Individual, Health, Life and Accident from September 2012 to August 2013; Chief Actuary, Cigna Global Individual, Health, Life and Accident, from December 2008 to September 2012.
CHRISTOPHER J. HOCEVAR, 44, President, Strategy, Segments and Solutions beginning February 2017; President, Pharmacy and Select Business from June 2013 to February 2017; President, Select Business beginning February 2011.
NICOLE S. JONES, 47, Executive Vice President and General Counsel of Cigna beginning June 2011; Senior Vice President and General Counsel of Lincoln Financial Group from May 2010 until June 2011; Vice President and Deputy General Counsel of Cigna from April 2008 until May 2010; and Corporate Secretary of Cigna from September 2006 until April 2010.
ALAN M. MUNEY, MD, MHA, 64, Executive Vice President, Total Health & Network and Chief Medical Officer beginning February 2017; joined Cigna as Senior Vice President, Total Health & Network in 2010 and named Chief Medical Officer in 2011.
JOHN M. MURABITO, 59, Executive Vice President, Human Resources and Services of Cigna beginning August 2003.
ERIC P. PALMER, 41, Executive Vice President and Chief Financial Officer beginning June 2017; Deputy Chief Financial Officer from February 2017 until June 2017; Senior Vice President, Chief Business Financial Officer from November 2015 to February 2017; Vice President, Business Financial Officer, Health Care from April 2012 to November 2015; and Vice President, Business Financial Officer, U.S. Commercial Markets from June 2010 to April 2012.
JASON D. SADLER, 49, President, International Markets beginning June 2014; President, Global Individual Health, Life and Accident from July 2010 until June 2014, and Managing Director Insurance Business Hong Kong, HSBC Insurance Asia Limited from January 2007 until July 2010.
MICHAEL W. TRIPLETT, 56, President, U.S. Markets beginning February 2017; Regional Segment Lead from June 2009 to February 2017.
| | | CIGNA CORPORATION - 2017 Form 10-K 31 |
PART II
ITEM 5. Market for Registrant's Common Equity, Related Stockholder Matters and Issuer Purchases of Equity Securities
PART II |
ITEM 5. Market for Registrant's Common Equity, Related Stockholder Matters and Issuer Purchases of Equity Securities |
The information under the caption "Quarterly Financial Data – Stock and Dividend Data" appears on page 108 of this Form 10-K. As of December 31, 2017, the number of shareholders of record was 5,618. Cigna's common stock is listed with, and trades on, the New York Stock Exchange under the symbol "CI".
Issuer Purchases of Equity Securities |
The following table provides information about Cigna's share repurchase activity for the quarter ended December 31, 2017:
| Period |
Total # of shares purchased (1) |
Average price paid per share |
Total # of shares purchased as part of publicly announced program (2) |
Approximate dollar value of shares that may yet be purchased as part of publicly announced program (3) |
||||
|---|---|---|---|---|---|---|---|---|
| | | | | | | | | |
October 1-31, 2017 |
1,416,046 | $190.43 | 1,415,061 | $1,501,096,013 | ||||
November 1-30, 2017 |
1,116,284 | $200.39 | 1,114,334 | $1,277,792,524 | ||||
December 1-31, 2017 |
1,358,593 | $205.88 | 1,357,938 | $998,215,883 | ||||
| | | | | | | | | |
Total |
3,890,923 | $198.68 | 3,887,333 | N/A | ||||
| | | | | | | | | |
| 32 CIGNA CORPORATION - 2017 Form 10-K | | |
PART II
ITEM 5. Market for Registrant's Common Equity, Related Stockholder Matters and Issuer Purchases of Equity Securities
Five Year Cumulative Total Shareholder Return*
December 31, 2012 – December 31, 2017

| |
12/31/2012 |
12/31/2013 |
12/31/2014 |
12/31/2015 |
12/31/2016 |
12/31/2017 |
||||||||||||
|---|---|---|---|---|---|---|---|---|---|---|---|---|---|---|---|---|---|---|
| | | | | | | | | | | | | | | | | | | |
Cigna |
$ | 100 | $ | 164 | $ | 193 | $ | 274 | $ | 250 | $ | 381 | ||||||
| | | | | | | | | | | | | | | | | | | |
S&P 500 |
$ | 100 | $ | 132 | $ | 151 | $ | 153 | $ | 171 | $ | 208 | ||||||
| | | | | | | | | | | | | | | | | | | |
S&P Managed Health Care, Life & Health Ins. Indexes** |
$ | 100 | $ | 152 | $ | 190 | $ | 220 | $ | 265 | $ | 368 | ||||||
| | | | | | | | | | | | | | | | | | | |
| | | CIGNA CORPORATION - 2017 Form 10-K 33 |
PART II
ITEM 6. Selected Financial Data
ITEM 6. Selected Financial Data |
The selected financial data should be read in conjunction with Management's Discussion and Analysis of Financial Condition and Results of Operations and the Consolidated Financial Statements and accompanying notes included elsewhere herein.
Highlights |
| (Dollars in millions, except per share amounts) |
2017 |
2016 |
2015 |
2014 |
2013 |
||||||||||
|---|---|---|---|---|---|---|---|---|---|---|---|---|---|---|---|
| | | | | | | | | | | | | | | | |
| Total revenues | $ | 41,616 | $ | 39,668 | $ | 37,876 | $ | 34,914 | $ | 32,380 | |||||
| Shareholders' net income | $ | 2,237 | $ | 1,867 | $ | 2,094 | $ | 2,102 | $ | 1,476 | |||||
| | | | | | | | | | | | | | | | |
| Net income | $ | 2,232 | $ | 1,843 | $ | 2,077 | $ | 2,094 | $ | 1,478 | |||||
| | | | | | | | | | | | | | | | |
| Shareholders' net income per share | |||||||||||||||
Basic |
$ | 8.92 | $ | 7.31 | $ | 8.17 | $ | 7.97 | $ | 5.28 | |||||
Diluted |
$ | 8.77 | $ | 7.19 | $ | 8.04 | $ | 7.83 | $ | 5.18 | |||||
| Common dividends declared per share | $ | 0.04 | $ | 0.04 | $ | 0.04 | $ | 0.04 | $ | 0.04 | |||||
| Cash and investments | $ | 31,591 | $ | 30,000 | $ | 26,681 | $ | 25,762 | $ | 25,160 | |||||
| Total assets | $ | 61,753 | $ | 59,360 | $ | 57,088 | $ | 55,870 | $ | 54,306 | |||||
| Long-term debt | $ | 5,199 | $ | 4,756 | $ | 5,020 | $ | 4,979 | $ | 4,984 | |||||
| Total liabilities | $ | 47,969 | $ | 45,575 | $ | 44,975 | $ | 44,991 | $ | 43,629 | |||||
| Shareholders' equity | $ | 13,735 | $ | 13,723 | $ | 12,035 | $ | 10,774 | $ | 10,567 | |||||
| | | | | | | | | | | | | | | | |
| 34 CIGNA CORPORATION - 2017 Form 10-K | | |
PART II
ITEM 7. Management's Discussion and Analysis of Financial Condition and Results of Operations
ITEM 7. Management's Discussion and Analysis of Financial Condition and Results of Operations |
Management's Discussion and Analysis of Financial Condition and Results of Operations ("MD&A") is intended to provide information to assist you in better understanding and evaluating our financial condition and results of operations. We encourage you to read this MD&A in conjunction with our Consolidated Financial Statements included in Part II, Item 8 of this Annual Report on Form 10-K ("Form 10-K") and the "Risk Factors" contained in Part I, Item 1A of this Form 10-K.
Unless otherwise indicated, financial information in the MD&A is presented in accordance with accounting principles generally accepted in the United States of America ("GAAP"). See Note 2 to our Consolidated Financial Statements for additional information regarding the Company's significant accounting policies. In some of our financial tables in this MD&A, we present either percentage changes or "N/M" when those changes are so large as to become not meaningful. Changes in percentages are expressed in basis points ("bps").
In this MD&A, our consolidated measures "operating revenues" and "adjusted income from operations" are not determined in accordance with GAAP and should not be viewed as substitutes for the most directly comparable GAAP measures "total revenues" and "shareholders' net income."
We define operating revenues as total revenues excluding realized investment results. We exclude realized investment results from this measure because our portfolio managers may sell investments based on factors largely unrelated to the underlying business purposes of each segment. As a result, gains or losses created in this process may not be indicative of past or future underlying performance of our businesses.
We use adjusted income from operations as our principal financial measure of operating performance because management believes it best reflects the underlying results of our business operations and permits analysis of trends in underlying revenue, expenses and profitability. We define adjusted income from operations as shareholders' net income excluding after-tax realized investment gains and losses, net amortization of other acquired intangible assets and special items. Income or expense amounts are excluded from adjusted income from operations for the following reasons:
Cigna Corporation, together with its subsidiaries (either individually or collectively referred to as "Cigna," the "Company," "we," "our" or "us") is a global health services organization dedicated to a mission of helping individuals improve their health, well-being and sense of security. To execute on our mission, Cigna's evolved strategy is to "Go Deeper", "Go Local" and "Go Beyond" with a differentiated set of medical, dental, disability, life and accident insurance and related products and services offered by our subsidiaries. In addition to these ongoing operations, we also have certain run-off operations.
For further information on our business and strategy, please see Item 1, "Business" in this Form 10-K. See Note 1 to our Consolidated Financial Statements for a description of our reporting segments.
| | | CIGNA CORPORATION - 2017 Form 10-K 35 |
PART II
ITEM 7. Management's Discussion and Analysis of Financial Condition and Results of Operations
Financial Summary |
Summarized below are certain key measures of our performance for the years ended December 31:
| |
For the Years Ended December 31, |
Increase (Decrease) |
Increase (Decrease) |
||||||||||||
|---|---|---|---|---|---|---|---|---|---|---|---|---|---|---|---|
| | | | | | | | | | | | | | | | |
(Dollars in millions, except per share amounts) |
2017 | 2016 | 2015 | 2017 vs. 2016 | 2016 vs. 2015 | ||||||||||
| | | | | | | | | | | | | | | | |
Total revenues (1) |
$ | 41,616 | $ | 39,668 | $ | 37,876 | | 5% | | 5% | |||||
| | | | | | | | | | | | | | | | |
Operating revenues (1) |
|||||||||||||||
Global Health Care |
$ | 32,617 | $ | 31,199 | $ | 29,929 | | 5% | | 4% | |||||
Global Supplemental Benefits |
3,872 | 3,385 | 3,149 | 14 | 7 | ||||||||||
Group Disability and Life |
| 4,441 | | 4,443 | | 4,271 | | – | | 4 | |||||
Other Operations |
468 | 472 | 485 | (1) | (3) | ||||||||||
Corporate |
| (19) | | – | | (15) | | N/M | | 100 | |||||
| | | | | | | | | | | | | | | | |
Total operating revenues (1) |
$ | 41,379 | $ | 39,499 | $ | 37,819 | 5% | 4% | |||||||
| | | | | | | | | | | | | | | | |
Shareholders' net income (1) |
$ | 2,237 | $ | 1,867 | $ | 2,094 | | 20% | | (11)% | |||||
| | | | | | | | | | | | | | | | |
Adjusted Income (Loss) From Operations (1) |
|||||||||||||||
Global Health Care |
$ | 2,173 | $ | 1,852 | $ | 1,848 | | 17% | | –% | |||||
Global Supplemental Benefits |
369 | 294 | 262 | 26 | 12 | ||||||||||
Group Disability and Life |
| 285 | | 125 | | 324 | | 128 | | (61) | |||||
Other Operations |
67 | 70 | 75 | (4) | (7) | ||||||||||
Corporate |
| (226) | | (237) | | (253) | | 5 | | 6 | |||||
| | | | | | | | | | | | | | | | |
Total adjusted income from operations (1) |
$ | 2,668 | $ | 2,104 | $ | 2,256 | 27% | (7)% | |||||||
| | | | | | | | | | | | | | | | |
Earnings per share (diluted) |
| | | | | ||||||||||
Shareholders' net income (1) |
$ | 8.77 | $ | 7.19 | $ | 8.04 | 22% | (11)% | |||||||
Adjusted income from operations (1) |
$ | 10.46 | $ | 8.10 | $ | 8.66 | | 29% | | (6)% | |||||
| | | | | | | | | | | | | | | | |
Global medical customers (in thousands) |
15,907 | 15,197 | 14,999 | 5% | 1% | ||||||||||
| | | | | | | | | | | | | | | | |
The charts on the following pages provide a comparison of our 2017 and 2016 results compared with each prior year.
|
|
||
|
2017 versus 2016 and 2016 versus 2015 – Increases in both 2017 and 2016 primarily reflected higher operating revenues driven by business growth as discussed further below. |
|
|
2017 versus 2016 – Increase driven by business growth in Global Health Care and Global Supplemental Benefits. 2016 versus 2015 – Increase resulted from business growth across all of our ongoing reportable segments. |
|
| 36 CIGNA CORPORATION - 2017 Form 10-K | | |
PART II
ITEM 7. Management's Discussion and Analysis of Financial Condition and Results of Operations
|
|
||
|
2017 versus 2016 – Increase due to higher adjusted income from operations across our reporting segments. Debt extinguishment costs and charges resulting from U.S. tax reform, both reported as special items in 2017, partially offset these increases. 2016 versus 2015 – Decrease due to lower adjusted income from operations, primarily in the Group Disability and Life segment. Increased special item charges in 2016 (primarily higher transaction costs and the 2016 risk corridor allowance) also contributed to the decline. |
|
|
2017 versus 2016 – Increase driven by higher earnings in each of our ongoing reportable segments. These increases were primarily a result of customer growth in Global Health Care and Global Supplemental Benefits and increased specialty contributions in Global Health Care. Improved claim experience in Group Disability and Life also contributed to the increase. 2016 versus 2015 – Decrease was a result of significantly lower earnings in Group Disability and Life reflecting unfavorable
claim experience. Costs related to the Government segment's response to the Centers for Medicare and Medicaid Services ("CMS") audit also contributed to the decline. Increased earnings contributions in Global Supplemental Benefits and the Commercial
segment partially offset those unfavorable impacts. |
|
|
|
||
|
2017 versus 2016 and 2016 versus 2015 – Increases in both 2017 and 2016 reflected growth in targeted markets for our Commercial segment. In 2017, these favorable effects were partially offset by expected disenrollment in the Government segment. |
|
Further discussion of detailed components of revenues and expenses can be found in the "Consolidated Results of Operations" section of this MD&A beginning on page 38. For further analysis and explanation of individual segment results, see the "Segment Reporting" section of this MD&A beginning on page 47.
Key Developments |
U.S. Tax Reform Legislation
Major U.S. tax reform legislation was signed into law on December 22, 2017. The legislation is highlighted by a reduction in the corporate income tax rate from the current 35% to 21% effective January 1, 2018. As further described on page 39 of this Form 10-K, we expect a significant decline in our effective tax rate beginning in 2018 as a result of the rate reduction. The remaining provisions of the law, most of which take effect on January 1, 2018, are not expected to have a material impact on the Company's results of operations beginning in 2018.
We recorded additional tax expense of $232 million in 2017 resulting from this legislation, comprised of $144 million due to the revaluation of deferred tax assets and liabilities to reflect the reduction in the corporate tax rate and $88 million due to the assessment of U.S. taxes related to the Company's accumulated unremitted foreign earnings. The legislation provides an election to pay these taxes over eight years and we expect to adopt this election. Both the revaluation of deferred tax assets and liabilities and the taxes on accumulated unremitted foreign earnings are considered provisional as certain adjustments used to calculate the tax at year-end were based on estimates.
| | | CIGNA CORPORATION - 2017 Form 10-K 37 |
PART II
ITEM 7. Management's Discussion and Analysis of Financial Condition and Results of Operations
Also as a result of tax reform, the Company recorded a reduction in operating expenses of $56 million ($36 million after-tax) reflecting a decrease in a liability to reimburse a reinsurer for taxes related to a block of business sold through reinsurance. An offsetting tax effect is included in the $144 million charge discussed above, resulting in no after-tax effect for this item.
See Note 20 to our Consolidated Financial Statements for additional information.
Termination of Proposed Merger with Anthem, Inc.
On May 12, 2017, we announced that the merger agreement between Cigna and Anthem, Inc. had been terminated.
See Note 21(E) to our Consolidated Financial Statements in this Form 10-K for additional details.
Consolidated Results of Operations (GAAP Basis) |
Financial Summary |
| For the Years Ended December 31, |
Increase (Decrease) |
Increase (Decrease) |
|||||||||||||||||||||
| | | | | | | | | | | | | | | | | | | | | | | | |
| (In millions) | 2017 | 2016 | 2015 | 2017 vs. 2016 | 2016 vs. 2015 | ||||||||||||||||||
| | | | | | | | | | | | | | | | | | | | | | | | |
| Premiums | $ | 32,307 | $ | 30,626 | $ | 29,642 | $ | 1,681 | | 5 | % | $ | 984 | | 3 | % | |||||||
| Fees and other revenues | 4,867 | 4,760 | 4,488 | 107 | 2 | 272 | 6 | ||||||||||||||||
| Net investment income | | 1,226 | | 1,147 | | 1,153 | | 79 | | 7 | | (6 | ) | | (1 | ) | |||||||
| Mail order pharmacy revenues | 2,979 | 2,966 | 2,536 | 13 | – | 430 | 17 | ||||||||||||||||
| | | | | | | | | | | | | | | | | | | | | | | | |
| Operating revenues | | 41,379 | | 39,499 | | 37,819 | | 1,880 | | 5 | | 1,680 | | 4 | |||||||||
| Net realized investment gains | 237 | 169 | 57 | 68 | 40 | 112 | 196 | ||||||||||||||||
| | | | | | | | | | | | | | | | | | | | | | | | |
| Total revenues | | 41,616 | | 39,668 | | 37,876 | | 1,948 | | 5 | | 1,792 | | 5 | |||||||||
| | | | | | | | | | | | | | | | | | | | | | | | |
| Global Health Care medical costs | 19,967 | 19,009 | 18,354 | 958 | 5 | 655 | 4 | ||||||||||||||||
| Other benefit expenses | | 5,439 | | 5,477 | | 4,936 | | (38) | | (1 | ) | | 541 | | 11 | ||||||||
| Mail order pharmacy costs | 2,456 | 2,468 | 2,134 | (12) | – | 334 | 16 | ||||||||||||||||
| Other operating expenses | | 10,033 | | 9,584 | | 8,982 | | 449 | | 5 | | 602 | | 7 | |||||||||
| Amortization of other acquired intangible assets, net | 115 | 151 | 143 | (36) | (24 | ) | 8 | 6 | |||||||||||||||
| | | | | | | | | | | | | | | | | | | | | | | | |
| Benefits and expenses | | 38,010 | | 36,689 | | 34,549 | | 1,321 | | 4 | | 2,140 | | 6 | |||||||||
| | | | | | | | | | | | | | | | | | | | | | | | |
| Income before income taxes | 3,606 | 2,979 | 3,327 | 627 | 21 | (348 | ) | (10 | ) | ||||||||||||||
| Income taxes | | 1,374 | | 1,136 | | 1,250 | | 238 | | 21 | | (114 | ) | | (9 | ) | |||||||
| | | | | | | | | | | | | | | | | | | | | | | | |
| Net income | 2,232 | 1,843 | 2,077 | 389 | 21 | (234 | ) | (11 | ) | ||||||||||||||
| Less: net (loss) attributable to noncontrolling interests | | (5) | | (24) | | (17) | | 19 | | 79 | | (7 | ) | | (41 | ) | |||||||
| | | | | | | | | | | | | | | | | | | | | | | | |
| Shareholders' net income | $ | 2,237 | $ | 1,867 | $ | 2,094 | $ | 370 | 20 | % | $ | (227 | ) | (11 | )% | ||||||||
| | | | | | | | | | | | | | | | | | | | | | | | |
Reconciliation of Shareholders' Net Income (GAAP) to Adjusted Income from Operations (non-GAAP): |
| For the Years Ended December 31, |
Increase (Decrease) | Increase (Decrease) |
|||||||||||||||||||
| | | | | | | | | | | | | | | | | | | | | | |
| (In millions) | 2017 | 2016 | 2015 | 2017 vs. 2016 | 2016 vs. 2015 |
||||||||||||||||
| | | | | | | | | | | | | | | | | | | | | | |
| Shareholders' net income | $ | 2,237 | $ | 1,867 | $ | 2,094 | $ | 370 | | 20% | $ | (227) | | (11)% | |||||||
| After-tax adjustments required to reconcile to adjusted income from operations | |||||||||||||||||||||
– Net realized investment (gains) |
| (156) | | (109) | | (40) | | (47) | | | | (69) | | | |||||||
– Amortization of other acquired intangible assets, net |
66 | 94 | 80 | (28) | 14 | ||||||||||||||||
| Special items | | | | | | | | ||||||||||||||
– U.S. tax reform (see Note 20 to our Consolidated Financial Statements) |
196 | – | – | 196 | – | ||||||||||||||||
– Debt extinguishment costs (see Note 5 to our Consolidated Financial Statements) |
| 209 | | – | | 65 | | 209 | | | | (65) | | | |||||||
– Long-term care guaranty fund assessment (see Note 21(D) to our Consolidated Financial Statements) |
83 | – | – | 83 | – | ||||||||||||||||
– Transaction-related costs (see Note 3 to our Consolidated Financial Statements) |
| 33 | | 147 | | 57 | | (114) | | | | 90 | | | |||||||
– Risk corridor allowance (see Note 22 to our Consolidated Financial Statements) |
– | 80 | – | (80) | 80 | ||||||||||||||||
– Charges associated with litigation matters discussed in Note 21(E) to our Consolidated Financial Statements |
| – | | 25 | | – | | (25) | | | | 25 | | | |||||||
| | | | | | | | | | | | | | | | | | | | | | |
| Adjusted income from operations | $ | 2,668 | $ | 2,104 | $ | 2,256 | $ | 564 | 27% | $ | (152) | (7)% | |||||||||
| | | | | | | | | | | | | | | | | | | | | | |
| 38 CIGNA CORPORATION - 2017 Form 10-K | | |
PART II
ITEM 7. Management's Discussion and Analysis of Financial Condition and Results of Operations
| For the Years Ended December 31, |
Change Favorable (Unfavorable) |
Change Favorable (Unfavorable) |
|||||||||||||||||
| | | | | | | | | | | | | | | | | | | | |
| Other Key Consolidated Financial Data | 2017 | 2016 | 2015 | 2017 vs. 2016 | 2016 vs. 2015 |
||||||||||||||
| | | | | | | | | | | | | | | | | | | | |
| Earnings per share (diluted) | | | | | | ||||||||||||||
| Shareholders' net income | $ | 8.77 | $ | 7.19 | $ | 8.04 | $ | 1.58 | 22% | $ | (0.85 | ) | (11)% | ||||||
| Per share impact of after-tax adjustments to shareholders' net income | | | | | | ||||||||||||||
– Net realized investment (gains) |
(0.61 | ) | (0.42 | ) | (0.15 | ) | (0.19 | ) | (0.27 | ) | |||||||||
– Amortization of other acquired intangible assets, net |
| 0.26 | | 0.36 | | 0.30 | | (0.10 | ) | | | 0.06 | | ||||||
– Special items (see Note 22 to our Consolidated Financial Statements for details) |
2.04 | 0.97 | 0.47 | 1.07 | 0.50 | ||||||||||||||
| | | | | | | | | | | | | | | | | | | | |
| Adjusted income from operations | $ | 10.46 | $ | 8.10 | $ | 8.66 | $ | 2.36 | 29% | $ | (0.56 | ) | (6)% | ||||||
| | | | | | | | | | | | | | | | | | | | |
| Effective tax rate | 38.1 | % | 38.1 | % | 37.6 | % | -bps | (50 | )bps | ||||||||||
| | | | | | | | | | | | | | | | | | | | |
Consolidated Results of Operations: 2017 versus 2016 and 2016 versus 2015 |
We expect our effective tax rate in 2018 to decrease significantly from 2017 as a result of enactment of the U.S. tax reform legislation. This favorable effect will be partially offset by the resumption of the health insurance industry tax.
| | | CIGNA CORPORATION - 2017 Form 10-K 39 |
PART II
ITEM 7. Management's Discussion and Analysis of Financial Condition and Results of Operations
Health Care Industry Developments and Other Matters Affecting Our Global Health Care Segment |
The "Regulation" section of this Form 10-K provides a detailed description of The Patient Protection and Affordable Care Act (the "ACA") provisions and other legislative initiatives that impact our health care business, including regulations issued by CMS and the Departments of the Treasury and Health and Human Services ("HHS"). In October 2017, President Trump issued an executive order that could result in a variety of changes to the individual and group health insurance markets when implemented. At this time, we are unable to determine the effect, if any, of these changes on our business or results of operations. In addition, the President ordered the immediate cessation of cost sharing reduction subsidy payments to insurers. Discussions on the ACA continue in the U.S. Congress. The table presented below provides an update of the impact of these items and other matters affecting our Global Health Care segment as of December 31, 2017.
| | | | | | | | | |
|
Item |
|
Description |
| ||||
| | | | | | | | | |
|
Medicare Advantage ("MA") |
CMS sanctions: On June 16, 2017, the Company received notification from CMS that the marketing and enrollment sanctions imposed by CMS on January 21, 2016 had been lifted. Cigna has resumed marketing of its Medicare Advantage-Prescription Drug and Medicare Part D Plans and began enrolling beneficiaries with effective dates beginning July 1, 2017. | ||||||
|
|
For the year ended December 31, 2017, Medicare enrollment and consolidated revenues were materially impacted due to our inability to participate in 2017 annual enrollment. However, 2017 shareholders' net income was not materially affected because the margin impact of the revenue loss was offset by lower operating expenses due to reduced remediation costs and other operational efficiencies that improved 2017 results. The impact of disenrollment was not material to 2016 consolidated revenues or earnings. |
||||||
|
|
Medicare Star Quality Ratings ("Star Ratings"): Medicare Advantage plans must have a Star Rating of four Stars or higher to qualify for bonus payments. We expect that approximately 60% of our Medicare Advantage customers will be in a four Star or greater plan for bonus payments to be received in 2018. In October 2017, CMS announced Star Ratings for plans for the 2019 payment year. We expect that approximately 40% of our Medicare Advantage customers will be in a four Star or greater plan for bonus payments to be received in 2019. Management continues to evaluate various actions to improve the Company's Star Ratings. |
||||||
|
2018 and 2019 MA Rates: Final MA reimbursement rates for 2018 were published by CMS in April 2017. Preliminary MA reimbursement rates for 2019 were published by CMS in February 2018. We expect these changes in rates to have an immaterial impact on our consolidated results of operations in 2018 and 2019. |
|||||||
| | | | | | | | | |
|
ACA Taxes and Fees • Industry Tax |
Health Insurance Industry Tax: Federal legislation imposed a moratorium on the health insurance industry tax for 2017 and 2019. The industry tax is being assessed in 2018 and, under current law, will return again in 2020 and beyond. For 2017, our premium rates reflected the moratorium and we would expect our target pricing actions to reflect the moratorium in 2019. The amount of the tax was approximately $310 million in both 2016 and 2015 ($170 million for Commercial and $140 million for Government in each year). | ||||||
|
|
The industry tax for Cigna in 2018 is expected to approximate $390 million ($260 million for Commercial and $130 million for Government). For our Commercial business, the fee is reflected in our 2018 premium rates, and is expected to result in an immaterial effect on shareholders' net income. For our Medicare business, we anticipate that the earnings impact of the tax will be more significant than in our Commercial business. However, we expect to offset its earnings impact in 2018 with benefit and pricing changes as well as growth. Because this tax is not deductible for federal income tax purposes, it will negatively impact our effective tax rate in 2018. |
||||||
|
• Reinsurance Fee |
Reinsurance Fee: This fee was applicable only from 2014 through 2016. For our insured business, the amount of the fee was approximately $45 million in 2016 and $70 million in 2015. |
||||||
| | | | | | | | | |
|
Public Health Exchanges |
Market Participation: For 2017, we offered individual coverage on seven public health insurance exchanges in the following states: Colorado, Illinois, Maryland, Missouri, North Carolina, Tennessee and Virginia. For 2018, we are offering individual coverage on the same exchanges with the exception of Maryland. | ||||||
|
|
Cost Sharing Reduction Subsidies: The ACA provides for cost sharing reductions that lower the amount that qualifying customers pay for deductibles, copayments and coinsurance. The federal government has provided funding for the cost sharing reduction subsidies to the qualifying customer's insurer. In October 2017, the Trump administration stopped payment of these subsidies to insurers. The attorneys general of 18 states and the District of Columbia have sued the Trump administration, seeking to require the administration to continue paying these subsidies. While the litigation is at a preliminary stage, on October 25, 2017, the court denied the request of the attorneys general for an injunction, allowing the government to cease providing the cost sharing reduction payments to insurers during the pendency of the matter. We will continue to monitor developments as the case proceeds. The impact of suspending cost sharing reduction subsidies was not material to 2017 consolidated earnings. Our pricing actions for the 2018 plan year have anticipated that the government would no longer pay for these subsidies, and we expect the impact on our future results of operations to be immaterial. |
||||||
|
|
Individual Mandate Repeal: The U.S. tax reform legislation also repealed the penalty charged to individuals without health insurance (known as the "individual mandate") effective January 1, 2019. While the impact on future premium rates and enrollment in the individual market is uncertain, we expect this repeal to have an immaterial impact on our future results of operations. |
||||||
| | | | | | | | | |
| 40 CIGNA CORPORATION - 2017 Form 10-K | | |
PART II
ITEM 7. Management's Discussion and Analysis of Financial Condition and Results of Operations
Risk Mitigation Programs |
See Note 2(K) to our Consolidated Financial Statements for a description of and our accounting policy for these programs that commenced in 2014. The risk corridor and reinsurance programs ended as of December 31, 2016.
The following table presents the after-tax (charges) and benefits to shareholders' net income from these programs for the years ended December 31, 2017, 2016 and 2015 and our net (payable) receivable balances as of December 31, 2017 and 2016.
| Net Receivable (Payable) Balance As of December 31, |
After-tax Impact on Shareholders' Net Income For the Years Ended December 31, |
||||||||||||||
| | | | | | | | | | | | | | | | |
| (In millions) | 2017 | 2016 | 2017 | 2016 | 2015 |
||||||||||
| | | | | | | | | | | | | | | | |
| Net risk adjustment (1)(2) | $ | (181) | $ | 1 | $ | (105) | $ | 25 | $ | 92 | |||||
| Net risk corridor (1) | – | – | – | (86) | 49 | ||||||||||
| Reinsurance (3) | | 8 | | 63 | | – | | 30 | | 125 | |||||
| | | | | | | | | | | | | | | | |
| Total risk mitigation balances | $ | (173) | $ | 64 | $ | (105) | $ | (31) | $ | 266 | |||||
| | | | | | | | | | | | | | | | |
In 2016, we recorded an allowance for the balance of our risk corridor receivable based on court decisions and the large risk corridor program deficit. As of December 31, 2017, we continued to hold an allowance for the balance of our risk corridor receivable of $109 million based on the current status of court decisions. However, we continue to believe that the government has a binding obligation to satisfy the risk corridor receivable.
Liquidity And Capital Resources |
| Financial Summary (In millions) |
2017 |
2016 |
2015 |
||||||
|---|---|---|---|---|---|---|---|---|---|
| | | | | | | | | | |
Short-term investments |
$ | 199 | $ | 691 | $ | 381 | |||
Cash and cash equivalents |
$ | 2,972 | $ | 3,185 | $ | 1,968 | |||
Short-term debt |
$ | 240 | $ | 276 | $ | 149 | |||
Long-term debt |
$ | 5,199 | $ | 4,756 | $ | 5,020 | |||
Shareholders' equity |
$ | 13,735 | $ | 13,723 | $ | 12,035 | |||
| | | | | | | | | | |
Liquidity |
We maintain liquidity at two levels: the subsidiary level and the parent company level.
Liquidity requirements at the subsidiary level generally consist of:
Our subsidiaries normally meet their operating requirements by:
Liquidity requirements at the parent company level generally consist of:
The parent company normally meets its liquidity requirements by:
Cash flows for the years ended December 31, were as follows:
| (In millions) |
2017 |
2016 |
2015 |
||||||
|---|---|---|---|---|---|---|---|---|---|
| | | | | | | | | | |
Net cash provided by operating activities (1)(2) |
$ | 4,086 | $ | 4,026 | $ | 2,933 | |||
Net cash (used in) investing activities (2) |
$ | (1,703) | $ | (2,574) | $ | (1,736) | |||
Net cash (used in) financing activities (1) |
$ | (2,651) | $ | (225) | $ | (609) | |||
| | | | | | | | | | |
| | | CIGNA CORPORATION - 2017 Form 10-K 41 |
PART II
ITEM 7. Management's Discussion and Analysis of Financial Condition and Results of Operations
Operating activities
Cash flows from operating activities consist of cash receipts and disbursements for premiums and fees, mail order pharmacy, other revenues, investment income, taxes, benefits and expenses. Because certain income and expense transactions do not generate cash, and because cash transactions related to revenues and expenses may occur in periods different from when those revenues and expenses are recognized in shareholders' net income, cash flows from operating activities can be significantly different from shareholders' net income.
Cash flows from operating activities increased slightly in 2017 compared with 2016 primarily driven by higher net income, partially offset by lower receipts from Medicare Part D and Medicare Advantage programs and a voluntary pension contribution of $150 million in 2017.
Cash flows from operating activities increased in 2016 compared with 2015 due to higher receipts from Medicare Part D and Medicare Advantage programs.
Investing activities
Cash flows from investing activities generally consist of net investment purchases or sales and net purchases of property and equipment including capitalized software, as well as cash used to acquire businesses.
Cash used in investing activities decreased in 2017 compared with 2016, primarily due to lower net investment purchases. In 2017, more cash was deployed to share repurchase than investment purchases in accordance with our capital management strategy discussed in the below "Capital Resources" section of this MD&A.
Cash used in investing activities increased in 2016 compared with 2015, due to higher purchases of fixed maturity investments.
Financing activities
Cash flows from financing activities are generally comprised of issuances and re-payment of debt at the parent company level, proceeds on the issuance of common stock resulting from stock option exercises, and stock repurchases. In addition, the subsidiaries report deposits to and withdrawals from investment contract liabilities (including universal life insurance liabilities) because such liabilities are considered financing activities with policyholders.
Cash used in financing activities increased in 2017 compared with 2016, primarily due to higher share repurchases. The 2017 proceeds from the Company's $1.6 billion debt issuance were largely offset by $1.3 billion paid to extinguish $1.0 billion of debt, as well as repaying maturing debt in the first quarter of 2017.
Cash used in financing activities decreased in 2016 compared with 2015, primarily due to lower share repurchases offset by lower proceeds from employees' exercise of stock options.
Share repurchase
We maintain a share repurchase program, authorized by our Board of Directors. Under this program, we may repurchase shares from time to time, depending on market conditions and alternate uses of capital. The timing and actual number of shares repurchased will depend on a variety of factors, including price, general business and market conditions, and alternate uses of capital. The share repurchase program may be effected through open market purchases or privately negotiated transactions in compliance with Rule 10b-18 under the Securities Exchange Act of 1934, as amended, including through Rule 10b5-1 trading plans. The program may be suspended or discontinued at any time.
In 2017, we repurchased 15.7 million shares for $2.8 billion. From January 1, 2018 through January 31, 2018 we repurchased 1.2 million shares for approximately $260 million. We repurchased 0.8 million shares for $110 million in 2016 and 5.5 million shares for $683 million in 2015.
Interest Expense |
Interest expense on long-term debt, short-term debt and capital leases was as follows:
| (In millions) |
2017 |
2016 |
2015 |
||||||
|---|---|---|---|---|---|---|---|---|---|
| | | | | | | | | | |
Interest expense |
$ | 243 | $ | 251 | $ | 252 | |||
| | | | | | | | | | |
Interest expense reported above excluded losses on the early extinguishment of debt.
The weighted average interest rate for outstanding short-term debt (primarily commercial paper) was 1.63% as of December 31, 2017. There was no commercial paper outstanding as of December 31, 2016.
Capital Resources |
Our capital resources (primarily retained earnings and proceeds from the issuance of debt and equity securities) provide protection for policyholders, furnish the financial strength to underwrite insurance risks and facilitate continued business growth.
Management, guided by regulatory requirements and rating agency capital guidelines, determines the amount of capital resources that we maintain. Management allocates resources to new long-term business commitments when returns, considering the risks, look promising and when the resources available to support existing business are adequate.
| 42 CIGNA CORPORATION - 2017 Form 10-K | | |
PART II
ITEM 7. Management's Discussion and Analysis of Financial Condition and Results of Operations
We prioritize our use of capital resources to:
The availability of capital resources will be impacted by equity and credit market conditions. Extreme volatility in credit or equity market conditions may reduce our ability to issue debt or equity securities.
Liquidity and Capital Resources Outlook |
At December 31, 2017, there was approximately $1.2 billion in cash and marketable investments available at the parent company level. In 2018, the parent company's combined cash obligations are expected to approximate $480 million for repayment of debt, interest and dividends. We expect to have sufficient liquidity to meet the obligations discussed above, based on the parent company's current cash position and current projections for subsidiary dividends. In addition, we actively monitor our debt obligations and engage in issuance or redemption activities as needed in accordance with our capital management strategy.
Our cash projections may not be realized and the demand for funds could exceed available cash if our ongoing businesses experience unexpected shortfalls in earnings, or we experience material adverse effects from one or more risks or uncertainties described more fully in the Risk Factors section of this Form 10-K. In those cases, we expect to have the flexibility to satisfy liquidity needs through a variety of measures, including intercompany borrowings. The parent company may borrow up to $1.1 billion from its insurance subsidiaries without additional state approval. We have additional liquidity available through short-term commercial paper borrowings and a committed $1.5 billion revolving credit facility. The revolving credit and letter of credit agreement is subject to the maximum debt leverage covenant. As of December 31, 2017, we have $9.3 billion of maximum borrowing capacity in the debt leverage covenant, in addition to the $5.4 billion of debt outstanding. See Note 5 to our Consolidated Financial Statements for additional information regarding the credit facility.
Though we believe we have adequate sources of liquidity, significant disruption or volatility in the capital and credit markets could affect our ability to access those markets for additional borrowings or increase costs associated with borrowing funds.
The state of Illinois continues to experience financial difficulties; however, some of their immediate cash flow constraints were alleviated by a bond offering issued during the fourth quarter of 2017. As a result, we have collected most of the receivables due as of December 31, 2017. The remaining amount due to us from the state of Illinois under our commercial and Medicaid contracts as of December 31, 2017 was immaterial. As of December 31, 2017, all of our contracts with the state of Illinois had been terminated.
We continue to maintain a capital management strategy to retain overseas a significant portion of the earnings from our foreign operations. These undistributed earnings are deployed outside of the United States predominantly in support of the liquidity and regulatory capital requirements of our foreign operations as well as to support growth initiatives overseas. As a result of the U.S. tax reform legislation enacted in December 2017, we recorded additional U.S. taxes of $88 million related to these undistributed earnings. The legislation provides an election to pay these taxes over eight years. We expect to adopt that election.
Unfunded Pension Plan Liability. As of December 31, 2017, our unfunded pension liability was $688 million, reflecting a decrease of $223 million from December 31, 2016. The decrease in the unfunded liability reflected strong investment asset returns and a contribution of $150 million in 2017, partially offset by the impact of a decrease in discount rates of approximately 45 basis points. No contributions are required in 2018 under the Pension Protection Act of 2006. See Note 15 to our Consolidated Financial Statements for additional information regarding our pension plans.
Guarantees and Contractual Obligations |
We are contingently liable for various contractual obligations entered into in the ordinary course of business. See the "Liquidity and Capital Resources" section of this MD&A beginning on page 41 for additional background on how we manage our liquidity requirements related to these obligations. The maturities of our primary contractual cash obligations, as of December 31, 2017, are estimated to be as follows:
| (In millions, on an undiscounted basis) |
Total |
Less than 1 year |
1-3 years |
4-5 years |
After 5 years |
||||||||||
|---|---|---|---|---|---|---|---|---|---|---|---|---|---|---|---|
| | | | | | | | | | | | | | | | |
On-Balance Sheet |
| | | | | ||||||||||
Insurance liabilities |
|||||||||||||||
Contractholder deposit funds |
$ | 6,797 | $ | 706 | $ | 907 | $ | 739 | $ | 4,445 | |||||
Future policy benefits |
11,497 | 709 | 1,445 | 1,213 | 8,130 | ||||||||||
Global Health Care medical costs payable |
| 2,735 | | 2,635 | | 41 | | 13 | | 46 | |||||
Unpaid claims and claim expenses |
5,570 | 1,792 | 1,071 | 721 | 1,986 | ||||||||||
Short-term debt |
| 244 | | 244 | | | | | | | |||||
Long-term debt |
8,185 | 235 | 1,011 | 1,493 | 5,446 | ||||||||||
Other long-term liabilities |
| 687 | | 129 | | 105 | | 114 | | 339 | |||||
Off-Balance Sheet |
|||||||||||||||
Purchase obligations |
| 1,806 | | 661 | | 780 | | 278 | | 87 | |||||
Operating leases |
582 | 130 | 207 | 131 | 114 | ||||||||||
| | | | | | | | | | | | | | | | |
Total |
$ | 38,103 | $ | 7,241 | $ | 5,567 | $ | 4,702 | $ | 20,593 | |||||
| | | | | | | | | | | | | | | | |
| | | CIGNA CORPORATION - 2017 Form 10-K 43 |
PART II
ITEM 7. Management's Discussion and Analysis of Financial Condition and Results of Operations
On balance sheet: |
Off-Balance Sheet: |
Purchase obligations. As of December 31, 2017, purchase obligations consisted of estimated payments required under contractual arrangements for future services and investment commitments as follows:
| (In millions) |
|
||
|---|---|---|---|
| | | | |
| Fixed maturities | $ | 118 | |
| Commercial mortgage loans | 21 | ||
| Limited liability entities (other long-term investments) | | 1,178 | |
| | | | |
Total investment commitments |
1,317 | ||
| Future service commitments | | 489 | |
| | | | |
| Total purchase obligations | $ | 1,806 | |
| | | | |
See Note 11 to our Consolidated Financial Statements for additional information.
Our estimated future service commitments primarily represent contracts for certain outsourced business processes and information technology maintenance and support. We generally have the ability to terminate these agreements, but do not anticipate doing so at this time. Purchase obligations exclude contracts that are cancelable without penalty and those that do not contractually require minimum levels of goods or services to be purchased.
Operating leases. For additional information, see Note 18 to our Consolidated Financial Statements.
Guarantees |
We are contingently liable for various financial and other guarantees provided in the ordinary course of business. See Note 21 to our Consolidated Financial Statements for additional information on guarantees.
Critical Accounting Estimates |
The preparation of Consolidated Financial Statements in accordance with GAAP requires management to make estimates and assumptions that affect reported amounts and related disclosures in the Consolidated Financial Statements. Management considers an accounting estimate to be critical if:
Management has discussed the development and selection of its critical accounting estimates with the Audit Committee of our Board of Directors and the Audit Committee has reviewed the disclosures presented below.
In addition to the estimates presented in the following table, there are other accounting estimates used in the preparation of our Consolidated Financial Statements, including estimates of liabilities for future policy benefits, as well as estimates with respect to postemployment and postretirement benefits other than pensions, certain compensation accruals, and income taxes.
| 44 CIGNA CORPORATION - 2017 Form 10-K | | |
PART II
ITEM 7. Management's Discussion and Analysis of Financial Condition and Results of Operations
Management believes the current assumptions used to estimate amounts reflected in our Consolidated Financial Statements are appropriate. However, if actual experience differs from the assumptions used in estimating amounts reflected in our Consolidated Financial Statements, the resulting changes could have a material adverse effect on our consolidated results of operations and, in certain situations, could have a material adverse effect on our liquidity and financial condition. The table below presents the adverse impacts of certain possible changes in assumptions. The effect of assumption changes in the opposite direction would be a positive impact to our consolidated results of operations, liquidity or financial condition, except for the assessments of impairment for goodwill and fixed maturities carried at a fair value below cost. The tax rate used to calculate the after-tax impact of assumption changes is based on the new corporate income tax rate discussed in the "Key Developments" section of this MD&A.
See Note 2 to our Consolidated Financial Statements for further information on significant accounting policies.
| Balance Sheet Caption / Nature of Critical Accounting Estimate |
Effect if Different Assumptions Used |
|
|---|---|---|
| | | |
| Goodwill | ||
At the acquisition date, goodwill represents the excess of the cost of businesses acquired over the fair value of their net assets. We completed our annual evaluations of goodwill for impairment during the third quarter of 2017. These evaluations were performed at the reporting unit level, based on discounted cash flow analyses or market data. The evaluations indicated that no impairment was required. Fair values of reporting units are estimated using models and assumptions that we believe a hypothetical market participant would use to determine a current transaction price. The significant assumptions and estimates used in determining fair value include the discount rate and future cash flows. A range of discount rates is used, corresponding with the reporting unit's weighted average cost of capital, consistent with that used for investment decisions considering the specific and detailed operating plans and strategies within the reporting unit. Projections of future cash flows are consistent with our annual planning process for revenues, claims, operating expenses, taxes, capital levels and long-term growth rates. In addition to these assumptions, we consider market data to evaluate the fair value of each reporting unit. |
If we do not achieve our earnings objectives or the cost of capital rises significantly, the assumptions and estimates underlying these impairment evaluations could be adversely affected and result in future impairment charges that would negatively impact our operating results. Based on our most recent evaluations, the fair value estimates of our reporting units exceed their carrying values by adequate margins. Future changes in the funding for our Medicare programs by the federal government could materially reduce revenues and profitability in our Government reporting unit and have a significant impact on its fair value. |
|
In our Government operating segment we contract with CMS and various state governmental agencies to provide managed health care services, including Medicare Advantage plans and Medicare-approved prescription drug plans. Estimated future cash flows for this reporting unit's business incorporate the potential effects of Medicare Advantage reimbursement rates for 2018 and beyond as discussed in the "Executive Overview" section of this MD&A. Revenues from the Medicare programs are dependent, in whole or in part, upon annual funding from the federal government through CMS. Funding for these programs is dependent on many factors including general economic conditions, continuing government efforts to contain health care costs and budgetary constraints at the federal level and general political issues and priorities. |
||
Goodwill as of December 31 was as follows (in millions): |
||
• 2017 – $6,164 |
|
|
• 2016 – $5,980 |
|
|
See Note 17 to our Consolidated Financial Statements for additional discussion of our goodwill. |
||
| | | |
|
Accounts payable, accrued expenses and other liabilities – pension liabilities |
||
|
These liabilities are estimates of the present value of the qualified and nonqualified pension benefits to be paid (attributed to employee service to date) net of the fair value of plan assets. The accrued pension benefit liability as of
December 31 was as follows (in millions):
• 2017 – $688
• 2016 – $911 See Note 15 to our Consolidated Financial Statements for assumptions and methods used to estimate pension liabilities. |
The discount rate is typically the most significant assumption in measuring the pension liability. We develop the discount rate by applying actual annualized yields at various durations from a discount rate curve constructed from high quality corporate bonds. Based on our historical experience, we believe that a 50 basis point change in the discount rate and a 10% decline in plan assets are reasonably possible outcomes. If discount rates for the qualified and nonqualified pension plans decreased by 50 basis points, the accrued pension benefit liability would increase by approximately $190 million as of December 31, 2017, resulting in an after-tax decrease to shareholders' equity of approximately $150 million. If the December 31, 2017 fair values of domestic qualified plan assets decreased by 10%, the accrued pension benefit liability would increase by approximately $425 million as of December 31, 2017, resulting in an after-tax decrease to shareholders' equity of approximately $335 million. |
|
| | | |
| | | CIGNA CORPORATION - 2017 Form 10-K 45 |
PART II
ITEM 7. Management's Discussion and Analysis of Financial Condition and Results of Operations
| Balance Sheet Caption / Nature of Critical Accounting Estimate |
Effect if Different Assumptions Used |
|
|---|---|---|
| | | |
|
Global Health Care medical costs payable |
||
|
Medical costs payable for the Global Health Care segment includes both reported claims and estimates for losses incurred but not yet reported. The liabilities for medical costs payable as of December 31 were as follows (in millions):
• 2017 – gross $2,719; net $2,454
• 2016 – gross $2,532; net $2,257 These liabilities are presented above both gross and net of reinsurance and other recoverables. See Note 7 to our Consolidated Financial Statements for additional information regarding assumptions and methods used to estimate this liability. |
As described in Note 7, Global Health Care medical costs payable is primarily impacted by assumptions related to completion factors and medical cost trend. Changes in either assumption from actual results could impact the Global Health Care medical costs payable balance as noted below. A large number of factors may cause the medical cost trend to vary from the Company's estimates, including: changes in medical management practices, changes in the level and mix of benefits offered and services utilized, and changes in medical practices. Completion factors may be affected if actual claims submission rates from providers differ from estimates (that can be influenced by a number of factors, including provider mix, and electronic versus manual submissions), or if changes to the Company's internal claims processing patterns occur. Based on studies of our claim experience, it is reasonably possible that a 100 basis point change in the medical cost trend and a 50 basis point change in completion factors could occur in the near term. A 100 basis point increase in the medical cost trend rate would increase this liability by approximately $35 million, resulting in a decrease in net income of approximately $30 million after-tax, and a 50 basis point decrease in completion factors would increase this liability by approximately $75 million, resulting in a decrease in net income of approximately $60 million after-tax. |
|
| | | |
| Unpaid claims and claim expenses – long-term disability reserves | ||
|
The liability for long-term disability reserves is the present value of estimated future benefits payments over the expected disability period and includes estimates for both reported claims and for claims incurred but not yet reported. Long-term disability reserves as of December 31 were as follows (in millions):
• 2017 – gross $3,884; net $3,790
• 2016 – gross $3,708; net $3,622 These liabilities are presented above both gross and net of reinsurance recoverables. See Note 8 to our Consolidated Financial Statements for additional information regarding assumptions and methods used to estimate this liability. |
As described in Note 8, key assumptions in the calculation of long-term disability reserves include the discount rate and claim resolution rates, both of which are reviewed annually and updated when experience or future expectations would indicate a necessary change. Based on recent and historical resolution rate patterns and changes in investment portfolio yields, it is reasonably possible that a 5 percent change in claim resolution rates and a 25 basis point change in the discount rate could occur. The discount rate is the interest rate used to discount the projected future benefit payments to their present value. The discount rate assumption is based on the projected investment yield of the assets supporting the reserves. A 25 basis point decrease in the discount rate would increase long-term disability reserves by approximately $45 million and decrease net income by approximately $35 million after-tax. Claim resolution rate assumptions involve many factors including claimant demographics, the type of contractual benefit provided and the time since initially becoming disabled. The Company uses its own historical experience to develop its claim resolution rates. A 5 percent decrease in the claim resolution rate would increase long-term disability reserves by approximately $90 million and decrease net income by approximately $70 million after-tax. |
|
| | | |
| Valuation of fixed maturity investments | ||
Most fixed maturities are classified as available for sale and are carried at fair value with changes in fair value recorded in accumulated other comprehensive income (loss) within shareholders' equity. Fair value is defined as the price at which an asset could be exchanged in an orderly transaction between market participants at the balance sheet date. Determining fair value for a financial instrument requires management judgment. The degree of judgment involved generally correlates to the level of pricing readily observable in the markets. Financial instruments with quoted prices in active markets or with market observable inputs to determine fair value, such as public securities, generally require less judgment. Conversely, private placements including more complex securities that are traded infrequently are typically measured using pricing models that require more judgment as to the inputs and assumptions used to estimate fair value. There may be a number of alternative inputs to select based on an understanding of the issuer, the structure of the security and overall market conditions. In addition, these factors are inherently variable in nature as they change frequently in response to market conditions. Approximately two-thirds of our fixed maturities are public securities, and one-third are private placement securities. See Notes 10 and 11(A) to our Consolidated Financial Statements for a discussion of our fair value measurements, the procedures performed by management to determine that the amounts represent appropriate estimates and our accounting policy regarding unrealized appreciation on fixed maturities. |
Typically, the most significant input in the measurement of fair value is the market interest rate used to discount the estimated future cash flows of the instrument. Such market rates are derived by calculating the appropriate spreads over comparable U.S. Treasury securities, based on the credit quality, industry and structure of the asset. If the interest rates used to calculate fair value increased by 100 basis points, the fair value of the total fixed maturity portfolio of $23 billion would decrease by approximately $1.5 billion, resulting in an after-tax decrease to shareholders' equity of approximately $0.9 billion. |
|
| | | |
| 46 CIGNA CORPORATION - 2017 Form 10-K | | |
PART II
ITEM 7. Management's Discussion and Analysis of Financial Condition and Results of Operations
| Balance Sheet Caption / Nature of Critical Accounting Estimate |
Effect if Different Assumptions Used |
|
|---|---|---|
| | | |
| Assessment of "other-than-temporary" impairments on fixed maturities | ||
|
Certain fixed maturities with a fair value below amortized cost are carried at fair value with changes in fair value recorded in accumulated other comprehensive income. For these investments, we have determined that the decline in fair value below
its amortized cost is temporary. To make this determination, we evaluated the expected recovery in value and our intent to sell or the likelihood of a required sale of the fixed maturity prior to an expected recovery. In making this evaluation, we
considered a number of general and specific factors including the regulatory, economic and market environments, length of time and severity of the decline, and the financial health and specific near term prospects of the issuer. The after-tax amounts as of December 31 in Accumulated Other Comprehensive Income for fixed maturities in an unrealized loss position were as follows (in millions):
• 2017 – ($80)
• 2016 – ($115) See Note 11 to our Consolidated Financial Statements for additional discussion of our review of declines in fair value, including information regarding our accounting policies for fixed maturities. |
If we subsequently determine that the excess of amortized cost over fair value is other-than-temporary for any or all of these fixed maturities, the amount recorded in accumulated other comprehensive income would be reclassified to shareholders' net income as an impairment loss. |
|
| | | |
Segment Reporting |
The following section of this MD&A discusses the results of each of our reporting segments. In these segment discussions, we present "operating revenues," defined as total revenues excluding realized investment results and "adjusted income from operations," defined as shareholders' net income excluding after-tax realized investment results, net amortization of other acquired intangible assets and special items. Ratios presented in this segment discussion exclude the same items as adjusted income from operations. See Note 22 to our Consolidated Financial Statements for additional discussion of these metrics.
In these segment discussions, we also present "adjusted margin," defined as adjusted income from operations divided by operating revenues.
See the MD&A Executive Overview beginning on page 35 for summarized financial results of each of our reporting segments.
Global Health Care Segment |
As described in the Segment Reporting introduction above, the performance of the Global Health Care segment is measured using adjusted income from operations. The key factors affecting adjusted income from operations for this segment are:
Results of Operations
Financial Summary |
| For the Years Ended December 31, |
Change Favorable (Unfavorable) |
Change Favorable (Unfavorable) |
||||||||||||||||||||
| | | | | | | | | | | | | | | | | | | | | | | |
| (In millions) | 2017 | 2016 | 2015 | 2017 vs. 2016 | 2016 vs. 2015 | |||||||||||||||||
| | | | | | | | | | | | | | | | | | | | | | | |
| Operating revenues | $ | 32,617 | $ | 31,199 | $ | 29,929 | $ | 1,418 | | 5 | % | $ | 1,270 | | 4 | % | ||||||
| | | | | | | | | | | | | | | | | | | | | | | |
| Adjusted income from operations | $ | 2,173 | $ | 1,852 | $ | 1,848 | $ | 321 | 17 | % | $ | 4 | – | % | ||||||||
| | | | | | | | | | | | | | | | | | | | | | | |
| Adjusted margin | | 6.7 | % | | 5.9 | % | | 6.2 | % | | 80 | bps | | | | (30 | )bps | | | |||
| Medical Care Ratios | ||||||||||||||||||||||
Commercial |
| 79.9 | % | | 79.3 | % | | 78.1 | % | | (60 | )bps | | | | (120 | )bps | | | |||
Government |
84.9 | % | 85.3 | % | 85.2 | % | 40 | bps | (10 | )bps | ||||||||||||
Consolidated Global Health Care |
| 81.4 | % | | 81.6 | % | | 80.9 | % | | 20 | bps | | | | (70 | )bps | | | |||
| Operating expense ratio | 20.9 | % | 21.5 | % | 21.4 | % | 60 | bps | (10 | )bps | ||||||||||||
| | | | | | | | | | | | | | | | | | | | | | | |
| | | CIGNA CORPORATION - 2017 Form 10-K 47 |
PART II
ITEM 7. Management's Discussion and Analysis of Financial Condition and Results of Operations
| As of December 31, | Increase (Decrease) |
Increase (Decrease) |
|||||||||||||||||||
| | | | | | | | | | | | | | | | | | | | | | |
| (Dollars in millions, customers in thousands) | 2017 | 2016 | 2015 | 2017 vs. 2016 | 2016 vs. 2015 | ||||||||||||||||
| | | | | | | | | | | | | | | | | | | | | | |
| Global Health Care medical costs payable | $ | 2,719 | $ | 2,532 | $ | 2,355 | $ | 187 | | 7 | % | $ | 177 | | 8% | ||||||
| Customers | |||||||||||||||||||||
Total commercial risk |
| 2,957 | | 2,576 | | 2,502 | | 381 | | 15 | % | | 74 | | 3% | ||||||
Total government |
487 | 566 | 567 | (79 | ) | (14 | )% | (1 | ) | –% | |||||||||||
| | | | | | | | | | | | | | | | | | | | | | |
| Total risk | | 3,444 | | 3,142 | | 3,069 | | 302 | | 10 | % | | 73 | | 2% | ||||||
| Service | 12,463 | 12,055 | 11,930 | 408 | 3 | % | 125 | 1% | |||||||||||||
| | | | | | | | | | | | | | | | | | | | | | |
| Total medical customers | | 15,907 | | 15,197 | | 14,999 | | 710 | | 5 | % | | 198 | | 1% | ||||||
| | | | | | | | | | | | | | | | | | | | | | |
2017 versus 2016 |
Operating revenues. The increase was primarily due to customer growth in our Commercial risk business, partially offset by lower customer enrollment in our Government segment.
Adjusted income from operations increased, reflecting higher earnings in both our Commercial and Government operating segments. The increase in the Commercial segment reflects customer growth including increased contributions from our specialty products and favorable claim experience in our U.S. Individual business. The Government segment's earnings growth reflects lower operating expenses related to the moratorium on the health insurance industry tax in 2017 and our 2016 CMS audit response, partially offset by lower customer enrollment. Adjusted income from operations included favorable after-tax prior year reserve development of $112 million for 2017; prior year reserve development in 2016 was not material.
Medical care ratios. The Commercial medical care ratio increased, reflecting the 2017 moratorium on the health insurance industry tax, offset by improved performance in our U.S. Individual business and favorable prior year reserve development.
The Government medical care ratio decreased slightly, reflecting increased premium rates and favorable prior year reserve development, partially offset by higher medical costs.
Operating expense ratio. The decrease was primarily due to the moratorium on the health insurance industry tax in 2017 and lower costs related to our 2016 CMS audit response.
2016 versus 2015 |
Operating revenues. The increase in operating revenues was due to growth in our Commercial segment primarily from increased specialty revenues and growth in Medicare Advantage customer volumes. Higher premium rates for most products (primarily to recover underlying medical cost trend) also contributed to the increase. These increases were partially offset by lower customer volumes in our Medicare Part D and U.S. Individual businesses.
Adjusted income from operations was flat, reflecting earnings growth in our Commercial segment, primarily due to increased contributions from specialty products partially offset by lower margins in our U.S. Individual business. This increase was offset by lower earnings in our Government segment primarily driven by costs related to our CMS audit response.
Medical care ratios. The Commercial medical care ratio increased, reflecting a less favorable medical care ratio in our stop loss business, lower premium due to the anticipated reduction of the ACA mandated fees in 2017 and less favorable prior year reserve development.
The Government medical care ratio increased slightly, reflecting higher medical costs in our Medicaid business and less favorable prior year development, mostly offset by improvements in the Medicare Part D business.
Operating expense ratio. The operating expense ratio increased slightly, reflecting costs related to our CMS audit response. Excluding those costs, the operating expense ratio decreased, reflecting higher revenue and operating efficiencies, partially offset by business initiative investments.
Other Items Affecting Health Care Results
Global Health Care Medical Costs Payable
Medical costs payable was higher as of December 31, 2017 compared with 2016, primarily due to customer growth in our commercial risk businesses and medical cost trend across all businesses. Medical costs payable was higher as of December 31, 2016 compared with 2015, primarily due to medical cost trend across all businesses and customer growth in our Commercial group business. See Note 7 to our Consolidated Financial Statements for additional information.
| 48 CIGNA CORPORATION - 2017 Form 10-K | | |
PART II
ITEM 7. Management's Discussion and Analysis of Financial Condition and Results of Operations
Medical Customers
A medical customer is defined as a person meeting any one of the following criteria:
Our medical customer base increased as of December 31, 2017 compared with 2016, reflecting growth across our Commercial market segments, partially offset by declines in our Medicare Advantage business. Our medical customer base increased as of December 31, 2016 compared with 2015, primarily driven by growth in our middle market, select and international market segments.
Global Supplemental Benefits Segment |
As described in the Segment Reporting introduction on page 47, the performance of the Global Supplemental Benefits segment is measured using adjusted income from operations. The key factors affecting adjusted income from operations for this segment are:
Throughout this discussion and the table presented below, prior period currency adjusted income from operations and operating revenues are calculated by applying the current period's exchange rates to reported results in the prior period. A strengthening U.S. dollar against foreign currencies decreases these measures, while a weakening U.S. dollar produces the opposite effect.
Results of Operations
Financial Summary |
| For the Years Ended December 31, |
Change Favorable (Unfavorable) |
Change Favorable (Unfavorable) |
||||||||||||||||||||
| | | | | | | | | | | | | | | | | | | | | | | |
| (In millions) | 2017 | 2016 | 2015 | 2017 vs. 2016 | 2016 vs. 2015 |
|||||||||||||||||
| | | | | | | | | | | | | | | | | | | | | | | |
| Operating revenues | $ | 3,872 | $ | 3,385 | $ | 3,149 | $ | 487 | | 14 | % | $ | 236 | | 7 | % | ||||||
| | | | | | | | | | | | | | | | | | | | | | | |
| Adjusted income from operations | $ | 369 | $ | 294 | $ | 262 | $ | 75 | 26 | % | $ | 32 | 12 | % | ||||||||
| | | | | | | | | | | | | | | | | | | | | | | |
| Operating revenues, using actual 2017 currency exchange rates | $ | 3,872 | $ | 3,426 | $ | 3,106 | $ | 446 | | 13 | % | $ | 320 | | 10 | % | ||||||
| Adjusted income from operations, using actual 2017 currency exchange rates | $ | 369 | $ | 300 | $ | 259 | $ | 69 | 23 | % | $ | 41 | 16 | % | ||||||||
| | | | | | | | | | | | | | | | | | | | | | | |
| Adjusted margin | | 9.5 | % | | 8.7 | % | | 8.3 | % | | 80 | bps | | | | 40 | bps | | | |||
| Loss ratio | 55.2 | % | 55.3 | % | 55.3 | % | 10 | bps | – | bps | ||||||||||||
| Acquisition cost ratio | | 17.3 | % | | 18.6 | % | | 19.3 | % | | 130 | bps | | | | 70 | bps | | | |||
| Expense ratio (excluding acquisition costs) | 17.4 | % | 17.9 | % | 18.3 | % | 50 | bps | 40 | bps | ||||||||||||
| | | | | | | | | | | | | | | | | | | | | | | |
2017 versus 2016 |
Operating revenues increased primarily due to business growth, particularly in the United States and South Korea, and the favorable impact of foreign currency movements, primarily in the South Korean Won.
Adjusted income from operations increased, reflecting business growth, primarily in South Korea and China, and lower acquisition cost ratios.
The segment's loss ratio decreased, primarily due to favorable claims experience, largely offset by a shift in business mix to products with higher loss ratios.
The acquisition cost ratio decreased due to lower spending in certain markets and a shift toward higher premium markets with lower acquisition costs, primarily in South Korea and the United States.
The decrease in the expense ratio (excluding acquisition costs) was primarily driven by strong expense management.
2016 versus 2015 |
Operating revenues were higher primarily due to new sales, particularly in South Korea and the United States, reflecting both customer growth and sales of higher premium products. These higher premiums were partially offset by lower persistency in the U.K. and the unfavorable impact of foreign currency movements, primarily in South Korea and the U.K.
| | | CIGNA CORPORATION - 2017 Form 10-K 49 |
PART II
ITEM 7. Management's Discussion and Analysis of Financial Condition and Results of Operations
Adjusted income from operations increased primarily due to business growth, largely in South Korea, and lower acquisition and operating cost ratios. These factors were partially offset by higher income taxes and the unfavorable impact of foreign currency movements, primarily in South Korea.
The segment's loss ratio was flat, reflecting favorable claims in South Korea, largely offset by a shift in business mix to products with higher loss ratios.
The acquisition cost ratio decreased due to a shift toward higher premium products with lower acquisition costs primarily in South Korea and the United States.
The decrease in the expense ratio (excluding acquisition costs) was primarily driven by operating efficiencies.
Other Items Affecting Global Supplemental Benefits Results
South Korea is the single largest geographic market for our Global Supplemental Benefits segment. South Korea generated 51% of the segment's operating revenues and 89% of the segment's adjusted income from operations in 2017. In 2017, our Global Supplemental Benefits segment operations in South Korea represented 5% of our consolidated operating revenues and 12% of consolidated adjusted income from operations.
As a global company, our business is exposed to risks inherent in foreign operations. We continue to monitor and evaluate the impacts of tensions in the Korean Peninsula.
Significant movements in foreign currency exchange rates could materially affect the reported results of the Global Supplemental Benefits segment.
Group Disability and Life Segment |
As described in the Segment Reporting introduction on page 47, the performance of the Group Disability and Life segment is measured using adjusted income from operations. The key factors affecting adjusted income from operations for this segment are:
Results of Operations
Financial Summary |
| For the Years Ended December 31, |
Change Favorable (Unfavorable) |
Change Favorable (Unfavorable) |
|||||||||||||||||||||
| | | | | | | | | | | | | | | | | | | | | | | | |
| (In millions) | 2017 | 2016 | 2015 | 2017 vs. 2016 | 2016 vs. 2015 | ||||||||||||||||||
| | | | | | | | | | | | | | | | | | | | | | | | |
| Operating revenues | $ | 4,441 | $ | 4,443 | $ | 4,271 | $ | (2 | ) | | – | % | $ | 172 | | 4 | % | ||||||
| | | | | | | | | | | | | | | | | | | | | | | | |
| Adjusted income from operations | $ | 285 | $ | 125 | $ | 324 | $ | 160 | 128 | % | $ | (199 | ) | (61 | )% | ||||||||
| | | | | | | | | | | | | | | | | | | | | | | | |
| Adjusted margin | | 6.4 | % | | 2.8 | % | | 7.6 | % | | 360 | bps | | | | (480 | )bps | | | ||||
| Loss ratio | 77.2 | % | 83.8 | % | 76.3 | % | 660 | bps | (750 | )bps | |||||||||||||
| Operating expense ratio | | 23.1 | % | | 22.4 | % | | 21.9 | % | | (70 | )bps | | | | (50 | )bps | | | ||||
| | | | | | | | | | | | | | | | | | | | | | | | |
During the first half of 2016, the Group Disability and Life segment experienced significant unfavorable claims in its disability and life businesses. While claims experience moderated during the second half of 2016 and normalized in 2017, the first half results dampened full year 2016 earnings.
Disability: We implemented modifications to our disability claims management process in the first quarter of 2016 to drive improved quality and consistency. These modifications extended the claims processing cycle and lowered the disability claim resolution rate. As our modified disability claims management process continued to mature during the latter half of 2016, our claim resolution rate significantly improved and operational margins normalized over the course of 2017.
Life: We experienced a period of elevated life claims in the second quarter of 2016, driven by substantially higher new claim incidence and sizes, both of which have normalized in subsequent periods.
2017 versus 2016 |
Operating revenues were relatively flat in 2017 compared with 2016 with higher investment income driven by higher asset levels offset by cancelations in non-core products.
| 50 CIGNA CORPORATION - 2017 Form 10-K | | |
PART II
ITEM 7. Management's Discussion and Analysis of Financial Condition and Results of Operations
Adjusted income from operations increased in 2017 compared with 2016 reflecting lower disability new claim incidence and a higher resolution rate as modifications to the disability claims management process discussed above continued to mature. In addition, life claims have returned to normal levels after a period of significantly elevated claims and a $17 million after-tax unfavorable reserve review, both in the second quarter of 2016.
The loss ratio decreased in 2017 compared with 2016 due to improvement in the disability claim resolution rate as noted above, lower disability new claim incidence and significantly improved life claims experience.
Operating expense ratio. The 2017 operating expense ratio increased compared with 2016 due to higher overhead costs.
2016 versus 2015 |
Operating revenues. Premiums and fees increased in 2016 compared with 2015 due to new business growth from disability and life sales. Net investment income also increased primarily due to higher average assets partially offset by lower yields.
Adjusted income from operations. Results decreased in 2016 compared with 2015 due primarily to unfavorable disability and life claims experience as well as the absence of favorable reserve reviews and a higher operating expense ratio. Results in 2016 included the unfavorable impact of reserve reviews of $18 million after-tax compared with a favorable impact of $55 million after-tax in 2015.
The loss ratio increased in 2016 compared with 2015 due to lower claim resolutions in disability, higher life claim incidence and sizes in the second quarter of 2016, and the unfavorable impact of reserve reviews as discussed above.
Operating expense ratio. The operating expense ratio increased in 2016 compared with 2015 primarily reflecting higher disability claim management costs.
Other Operations |
As described in the Segment Reporting introduction on page 47, the performance of the Other Operations segment is measured using adjusted income from operations. Cigna's corporate-owned life insurance ("COLI") business contributes the majority of earnings in Other Operations. Cigna's Other Operations segment also includes the results from the run-off reinsurance and settlement annuity businesses, as well as the remaining deferred gains recognized from the sale of the individual life insurance and annuity and retirement benefits businesses.
Results of Operations
Financial Summary |
| For the Years Ended December 31, |
Change Favorable (Unfavorable) |
Change Favorable (Unfavorable) |
||||||||||||||||||||
| | | | | | | | | | | | | | | | | | | | | | | |
| (In millions) | 2017 | 2016 | 2015 | 2017 vs. 2016 | 2016 vs. 2015 |
|||||||||||||||||
| | | | | | | | | | | | | | | | | | | | | | | |
| Operating revenues | $ | 468 | $ | 472 | $ | 485 | $ | (4 | ) | | (1 | )% | $ | (13 | ) | | (3 | )% | ||||
| Adjusted income from operations | $ | 67 | $ | 70 | $ | 75 | $ | (3 | ) | (4 | )% | $ | (5 | ) | (7 | )% | ||||||
| | | | | | | | | | | | | | | | | | | | | | | |
| Adjusted margin | | 14.3 | % | | 14.8 | % | | 15.5 | % | | (50 | )bps | | | | (70 | )bps | | | |||
| | | | | | | | | | | | | | | | | | | | | | | |
Operating revenues decreased in 2017 compared with 2016 primarily due to lower investment income yields across all businesses, partially offset by lower ceded premiums in the COLI business. The decrease in operating revenues in 2016 compared with 2015 was largely due to lower net investment income driven by lower investment yields.
Adjusted income from operations in 2017 decreased compared with 2016, reflecting less favorable mortality experience partially offset by higher interest margins in COLI. Adjusted income from operations decreased in 2016 compared with 2015, reflecting less favorable mortality experience and lower interest margins in COLI.
Corporate |
Corporate reflects amounts not allocated to operating segments, including net interest expense (defined as interest on corporate debt less net investment income on investments not supporting segment operations), interest on uncertain tax positions, certain litigation matters, intersegment eliminations, compensation cost for stock options and related excess tax benefits, expense associated with our frozen pension plans and certain overhead and project costs.
Financial Summary |
| For the Years Ended December 31, |
Change Favorable (Unfavorable) |
Change Favorable (Unfavorable) |
||||||||||||||||||||
| | | | | | | | | | | | | | | | | | | | | | | |
| (In millions) | 2017 | 2016 | 2015 | 2017 vs. 2016 | 2016 vs. 2015 |
|||||||||||||||||
| | | | | | | | | | | | | | | | | | | | | | | |
| Adjusted loss from operations | $ | (226 | ) | $ | (237 | ) | $ | (253 | ) | $ | 11 | | 5 | % | $ | 16 | | 6 | % | |||
| | | | | | | | | | | | | | | | | | | | | | | |
| | | CIGNA CORPORATION - 2017 Form 10-K 51 |
PART II
ITEM 7. Management's Discussion and Analysis of Financial Condition and Results of Operations
Corporate's adjusted loss from operations was lower in 2017 compared with 2016, primarily due to higher excess tax benefits on stock compensation driven by increased option exercise activity in 2017. Higher net investment income also contributed to the lower loss, partially offset by higher operating expenses. Corporate's adjusted loss from operations decreased in 2016 compared with 2015, primarily due to recognizing excess tax benefits on stock compensation in net income beginning in 2016 as a result of our early adoption of ASU 2016-09.
Investment Assets |
The following table presents our invested asset portfolio, excluding separate account assets, as of December 31, 2017 and 2016. Additional information regarding our investment assets and related accounting policies is included in Notes 2, 10, 11, 12, 13, and 14 to our Consolidated Financial Statements.
| (In millions) |
2017 |
2016 |
||||
|---|---|---|---|---|---|---|
| | | | | | | |
| Fixed maturities | $ | 23,138 | $ | 20,961 | ||
| Equity securities | 588 | 583 | ||||
| Commercial mortgage loans | | 1,761 | | 1,666 | ||
| Policy loans | 1,415 | 1,452 | ||||
| Other long-term investments | | 1,518 | | 1,462 | ||
| Short-term investments | 199 | 691 | ||||
| | | | | | | |
| Total | $ | 28,619 | $ | 26,815 | ||
| | | | | | | |
Fixed Maturities |
Investments in fixed maturities include publicly traded and privately placed debt securities, mortgage and other asset-backed securities and preferred stocks redeemable by the investor. These investments are classified as available for sale and are carried at fair value on our balance sheet. Additional information regarding valuation methodologies, key inputs and controls is included in Note 10 to our Consolidated Financial Statements. More detailed information about fixed maturities by type of issuer and maturity dates is included in Note 11 to our Consolidated Financial Statements.
The following table reflects our fixed maturity portfolio by type of issuer as of December 31, 2017 and 2016.
| (In millions) |
2017 |
2016 |
||||
|---|---|---|---|---|---|---|
| | | | | | | |
| Federal government and agency | $ | 779 | $ | 877 | ||
| State and local government | 1,287 | 1,435 | ||||
| Foreign government | | 2,487 | | 2,113 | ||
| Corporate | 18,088 | 16,050 | ||||
| Mortgage and other asset-backed | | 497 | | 486 | ||
| | | | | | | |
| Total | $ | 23,138 | $ | 20,961 | ||
| | | | | | | |
The fixed maturity portfolio increased $2.2 billion during the 12 months ended December 31, 2017, primarily reflecting an increase in investable funds. As of December 31, 2017, $20.5 billion, or 89%, of the fixed maturities in our investment portfolio were investment grade (Baa and above, or equivalent), and the remaining $2.6 billion were below investment grade. The majority of the bonds that are below investment grade are rated at the higher end of the non-investment grade spectrum. These quality characteristics have not materially changed from the prior year and are consistent with our investment strategy.
State and local government. Our investment in state and local government securities, with an average quality rating of Aa2, was diversified by issuer and geography with no single exposure greater than $35 million as of December 31, 2017. We assess each issuer's credit quality based on a fundamental analysis of underlying financial information and do not rely solely on statistical rating organizations or monoline insurer guarantees.
Foreign government. We invested in high quality foreign government obligations with an average quality rating of Aa3 as of December 31, 2017. These investments were concentrated in Asia, primarily South Korea, consistent with the geographic locations of our international business operations. Foreign government obligations also included $243 million of investments in European sovereign debt, none of which are in countries with significant political or economic concerns such as Portugal, Italy, Ireland, Greece, Spain and Turkey.
Corporate. As of December 31, 2017, corporate fixed maturities included the following:
| 52 CIGNA CORPORATION - 2017 Form 10-K | | |
PART II
ITEM 7. Management's Discussion and Analysis of Financial Condition and Results of Operations
In addition to amounts classified in fixed maturities on our Consolidated Balance Sheets, we operate an insurance joint venture in China in which we have a 50% ownership interest. We account for this joint venture on the equity basis of accounting and report it in other assets, including other intangibles. This entity had an investment portfolio of approximately $4.9 billion supporting this business that is primarily invested in local Chinese corporate and government fixed maturities. There were no investments with a material unrealized loss as of December 31, 2017.
Equity Securities |
As of December 31, 2017, approximately $400 million in equity securities were invested in an exchange traded fund ("ETF") as part of a program to invest available cash in high quality and liquid assets. The underlying assets of the ETF are primarily U.S. investment grade corporate bonds and there was a gross unrealized gain of $10 million as of December 31, 2017 due to a decrease in market yields since purchase.
Commercial Mortgage Loans |
Our commercial mortgage loans are fixed rate loans, diversified by property type, location and borrower. Loans are secured by high quality commercial properties and are generally made at less than 70% of the property's value at origination of the loan. Property value, debt service coverage, quality, building tenancy and stability of cash flows are all important financial underwriting considerations. We hold no direct residential mortgage loans and do not originate or service securitized mortgage loans.
We completed the annual in-depth review of our commercial mortgage loan portfolio during the second quarter of 2017. The results of the 2017 review were in line with the prior year and confirmed the strength of the overall portfolio. For further discussion of the results of this review and changes in key loan metrics, see Note 11 to our Consolidated Financial Statements.
Commercial real estate capital markets remain very active for well-leased, quality commercial real estate located in strong institutional investment markets. The vast majority of properties securing the mortgages in our mortgage loan portfolio possess these characteristics. As of December 31, 2017, we had $135 million of commercial mortgage loans in the retail sector for various shopping centers in the United States. The loan-to-value ratio for these loans was 49%, and the debt service coverage ratio was 2.15. All of these loans are current.
As of December 31, 2017, the $1.8 billion commercial mortgage loan portfolio consisted of approximately 60 loans that are all in good standing. Given the quality and diversity of the underlying real estate, positive debt service coverage and significant borrower cash investment generally ranging between 30 and 40%, we remain confident that borrowers will continue to perform as expected under their contract terms.
Other Long-term Investments |
Other long-term investments of $1.5 billion included investments in securities limited partnerships and real estate limited partnerships as well as direct investments in real estate joint ventures. The funds typically invest in mezzanine debt or equity of privately held companies (securities partnerships) and equity real estate. Given our subordinate position in the capital structure of these underlying entities, we assume a higher level of risk for higher expected returns. To mitigate risk, these investments are diversified across approximately 125 separate partnerships, and approximately 60 general partners who manage one or more of these partnerships. Also, the funds' underlying investments are diversified by industry sector or property type, and geographic region. No single partnership investment exceeded 4% of our securities and real estate partnership portfolio.
Problem and Potential Problem Investments |
"Problem" bonds and commercial mortgage loans are either delinquent by 60 days or more or have been restructured as to terms, including concessions by us for modification of interest rate, principal payment or maturity date. "Potential problem" bonds and commercial mortgage loans are considered current (no payment is more than 59 days past due), but management believes they have certain characteristics that increase the likelihood that they may become problems. The characteristics management considers include, but are not limited to, the following:
We recognize interest income on problem bonds and commercial mortgage loans only when payment is actually received because of the risk profile of the underlying investment. The amount that would have been reflected in net income if interest on non-accrual investments had been recognized in accordance with their original terms was not significant for 2017 or 2016.
| | | CIGNA CORPORATION - 2017 Form 10-K 53 |
PART II
ITEM 7. Management's Discussion and Analysis of Financial Condition and Results of Operations
The following table shows problem and potential problem investments at amortized cost, net of valuation reserves and write-downs:
| December 31, 2017 | December 31, 2016 |
|||||||||||||||||
| | | | | | | | | | | | | | | | | | | |
| (In millions) | Gross | Reserve | Net | Gross | Reserve | Net | ||||||||||||
| | | | | | | | | | | | | | | | | | | |
| Problem bonds | $ | 25 | $ | (7) | $ | 18 | $ | 70 | $ | (9) | $ | 61 | ||||||
| Problem commercial mortgage loans | – | – | – | 26 | (5) | 21 | ||||||||||||
| Foreclosed real estate | | 46 | | – | | 46 | | 49 | | – | | 49 | ||||||
| | | | | | | | | | | | | | | | | | | |
| Total problem investments | $ | 71 | $ | (7) | $ | 64 | $ | 145 | $ | (14) | $ | 131 | ||||||
| | | | | | | | | | | | | | | | | | | |
| Potential problem bonds | $ | 31 | $ | (1) | $ | 30 | $ | 12 | $ | (7) | $ | 5 | ||||||
| Potential problem commercial mortgage loans | – | – | – | – | – | – | ||||||||||||
| | | | | | | | | | | | | | | | | | | |
| Total potential problem investments | $ | 31 | $ | (1) | $ | 30 | $ | 12 | $ | (7) | $ | 5 | ||||||
| | | | | | | | | | | | | | | | | | | |
Problem and potential problem investments decreased by $42 million since December 31, 2016 primarily due to payoffs and paydowns of problem bonds and mortgage loans.
Investment Outlook |
Although financial markets in the United States remained stable during 2017, we continue to closely monitor global macroeconomic trends and their potential impact to our investment portfolio. Certain sectors, such as retail, energy and natural gas have experienced stress and volatility and we expect that to continue. See the fixed maturities and commercial mortgage loan sections of this MD&A for further information on our investments in these sectors. Future realized and unrealized investment results will be driven largely by market conditions that exist when a transaction occurs or at the reporting date. These future conditions are not reasonably predictable; however, we believe that the vast majority of our investments will continue to perform under their contractual terms. Based on our strategy to match the duration of invested assets to the duration of insurance and contractholder liabilities, we expect to hold a significant portion of these assets for the long term. Although future impairment losses resulting from interest rate movements and credit deterioration due to both investment-specific and the global economic uncertainties discussed above remain possible, we do not expect these losses to have a material adverse effect on our financial condition or liquidity.
Market Risk |
Financial Instruments |
Our assets and liabilities include financial instruments subject to the risk of potential losses from adverse changes in market rates and prices. Consistent with disclosure requirements, the following items have been excluded from this consideration of market risk for financial instruments:
Excluding these items, our primary market risk exposures from financial instruments are:
Our Management of Market Risks |
We predominantly rely on three techniques to manage our exposure to market risk:
See Note 12 to our Consolidated Financial Statements for additional information about derivative financial instruments.
| 54 CIGNA CORPORATION - 2017 Form 10-K | | |
PART II
ITEM 7. Management's Discussion and Analysis of Financial Condition and Results of Operations
Effect of Market Fluctuations |
The examples that follow illustrate the adverse effect of hypothetical changes in market rates or prices on the fair value of certain financial instruments including:
The effects of hypothetical changes in market rates or prices on the fair values of certain of our financial instruments, subject to the exclusions noted above (particularly insurance liabilities), would have been as follows as of December 31:
|
Loss in fair value | |||||
| | | | | | | |
Market scenario for certain non-insurance financial instruments (in billions) |
2017 | 2016 | ||||
| | | | | | | |
100 basis point increase in interest rates |
$ | 1.2 | $ | 1.0 | ||
10% strengthening in U.S. dollar to foreign currencies |
$ | 0.5 | $ | 0.4 | ||
| | | | | | | |
The effect of a hypothetical increase in interest rates was determined by estimating the present value of future cash flows using various models, primarily duration modeling. The impact of a hypothetical increase to interest rates at December 31, 2017 was greater than that at December 31, 2016 reflecting increased purchases of fixed maturities partially offset by additional issuances of long-term debt.
The effect of a hypothetical strengthening of the U.S. dollar relative to the foreign currencies of certain financial instruments held by us was estimated to be 10% of the U.S. dollar equivalent fair value. Our foreign operations hold investment assets, such as fixed maturities, cash, and cash equivalents, that are generally invested in the currency of the related liabilities. The effect of a hypothetical 10% strengthening in the U.S. dollar to foreign currencies at December 31, 2017 was greater than that effect at December 31, 2016 due to increased amounts of investments that are primarily denominated in the South Korean won.
| | | CIGNA CORPORATION - 2017 Form 10-K 55 |
PART II
ITEM 7A. Quantitative and Qualitative Disclosures about Market Risk
ITEM 7A. Quantitative and Qualitative Disclosures About Market Risk |
The information contained under the caption "Market Risk" in the MD&A section of this Form 10-K is incorporated by reference.
| 56 CIGNA CORPORATION - 2017 Form 10-K | | |
PART II
ITEM 8. Financial Statements and Supplementary Data
ITEM 8. Financial Statements and Supplementary Data |
Report of Independent Registered Public Accounting Firm
To the Board of Directors
and Shareholders of Cigna Corporation
Opinions on the Financial Statements and Internal Control over Financial Reporting
We have audited the accompanying consolidated balance sheets of Cigna Corporation and its subsidiaries as of December 31, 2017 and 2016, and the related consolidated statements of income, comprehensive income, changes in total equity and cash flows for each of the three years in the period ended December 31, 2017, including the related notes (collectively referred to as the "consolidated financial statements"). We also have audited the Company's internal control over financial reporting as of December 31, 2017, based on criteria established in Internal Control – Integrated Framework (2013) issued by the Committee of Sponsoring Organizations of the Treadway Commission (COSO).
In our opinion, the consolidated financial statements referred to above present fairly, in all material respects, the financial position of the Company as of December 31, 2017 and 2016, and the results of their operations and their cash flows for each of the three years in the period ended December 31, 2017 in conformity with accounting principles generally accepted in the United States of America. Also in our opinion, the Company maintained, in all material respects, effective internal control over financial reporting as of December 31, 2017 based on criteria established in Internal Control – Integrated Framework (2013) issued by the COSO.
Basis for Opinions
The Company's management is responsible for these consolidated financial statements, for maintaining effective internal control over financial reporting, and for its assessment of the effectiveness of internal control over financial reporting, included in the accompanying Management's Annual Report on Internal Control over Financial Reporting. Our responsibility is to express opinions on the Company's consolidated financial statements and on the Company's internal control over financial reporting based on our audits. We are a public accounting firm registered with the Public Company Accounting Oversight Board (United States) ("PCAOB") and are required to be independent with respect to the Company in accordance with the U.S. federal securities laws and the applicable rules and regulations of the Securities and Exchange Commission and the PCAOB.
We conducted our audits in accordance with the standards of the PCAOB. Those standards require that we plan and perform the audits to obtain reasonable assurance about whether the consolidated financial statements are free of material misstatement, whether due to error or fraud, and whether effective internal control over financial reporting was maintained in all material respects.
Our audits of the consolidated financial statements included performing procedures to assess the risks of material misstatement of the consolidated financial statements, whether due to error or fraud, and performing procedures that respond to those risks. Such procedures included examining, on a test basis, evidence regarding the amounts and disclosures in the consolidated financial statements. Our audits also included evaluating the accounting principles used and significant estimates made by management, as well as evaluating the overall presentation of the consolidated financial statements. Our audit of internal control over financial reporting included obtaining an understanding of internal control over financial reporting, assessing the risk that a material weakness exists, and testing and evaluating the design and operating effectiveness of internal control based on the assessed risk. Our audits also included performing such other procedures as we considered necessary in the circumstances. We believe that our audits provide a reasonable basis for our opinions.
Definition and Limitations of Internal Control over Financial Reporting
A company's internal control over financial reporting is a process designed to provide reasonable assurance regarding the reliability of financial reporting and the preparation of financial statements for external purposes in accordance with generally accepted accounting principles. A company's internal control over financial reporting includes those policies and procedures that (i) pertain to the maintenance of records that, in reasonable detail, accurately and fairly reflect the transactions and dispositions of the assets of the company; (ii) provide reasonable assurance that transactions are recorded as necessary to permit preparation of financial statements in accordance with generally accepted accounting principles, and that receipts and expenditures of the company are being made only in accordance with authorizations of management and directors of the company; and (iii) provide reasonable assurance regarding prevention or timely detection of unauthorized acquisition, use, or disposition of the company's assets that could have a material effect on the financial statements.
Because of its inherent limitations, internal control over financial reporting may not prevent or detect misstatements. Also, projections of any evaluation of effectiveness to future periods are subject to the risk that controls may become inadequate because of changes in conditions, or that the degree of compliance with the policies or procedures may deteriorate.
/s/ PricewaterhouseCoopers LLP Hartford, Connecticut February 28, 2018 |
We have served as the Company's auditor since 1983.
| | | CIGNA CORPORATION - 2017 Form 10-K 57 |
PART II
ITEM 8. Financial Statements and Supplementary Data
Cigna Corporation |
| For the Years Ended December 31, |
|||||||||
| | | | | | | | | | |
| (In millions, except per share amounts) | 2017 | 2016 | 2015 |
||||||
| | | | | | | | | | |
| Revenues | | | | ||||||
| Premiums | $ | 32,307 | $ | 30,626 | $ | 29,642 | |||
| Fees and other revenues | | 4,867 | | 4,760 | | 4,488 | |||
| Net investment income | 1,226 | 1,147 | 1,153 | ||||||
| Mail order pharmacy revenues | | 2,979 | | 2,966 | | 2,536 | |||
| Realized investment gains (losses) | |||||||||
Other-than-temporary impairments on fixed maturities |
| (27) | | (35) | | (112) | |||
Other realized investment gains, net |
264 | 204 | 169 | ||||||
| | | | | | | | | | |
Net realized investment gains |
| 237 | | 169 | | 57 | |||
| | | | | | | | | | |
TOTAL REVENUES |
41,616 | 39,668 | 37,876 | ||||||
| | | | | | | | | | |
| Benefits and expenses | | | | ||||||
| Global Health Care medical costs | 19,967 | 19,009 | 18,354 | ||||||
| Other benefit expenses | | 5,439 | | 5,477 | | 4,936 | |||
| Mail order pharmacy costs | 2,456 | 2,468 | 2,134 | ||||||
| Other operating expenses | | 10,033 | | 9,584 | | 8,982 | |||
| Amortization of other acquired intangible assets, net | 115 | 151 | 143 | ||||||
| | | | | | | | | | |
TOTAL BENEFITS AND EXPENSES |
| 38,010 | | 36,689 | | 34,549 | |||
| | | | | | | | | | |
| Income before income taxes | 3,606 | 2,979 | 3,327 | ||||||
| | | | | | | | | | |
| Income taxes | | | | ||||||
| Current | 1,132 | 1,062 | 1,229 | ||||||
| Deferred | | 242 | | 74 | | 21 | |||
| | | | | | | | | | |
TOTAL INCOME TAXES |
1,374 | 1,136 | 1,250 | ||||||
| | | | | | | | | | |
| Net income | | 2,232 | | 1,843 | | 2,077 | |||
| Less: Net (loss) attributable to noncontrolling interests | (5) | (24) | (17) | ||||||
| | | | | | | | | | |
| SHAREHOLDERS' NET INCOME | $ | 2,237 | $ | 1,867 | $ | 2,094 | |||
| | | | | | | | | | |
| Shareholders' net income per share | |||||||||
| Basic | $ | 8.92 | $ | 7.31 | $ | 8.17 | |||
| Diluted | $ | 8.77 | $ | 7.19 | $ | 8.04 | |||
| Dividends declared per share | $ | 0.04 | $ | 0.04 | $ | 0.04 | |||
| | | | | | | | | | |
The accompanying Notes to the Consolidated Financial Statements are an integral part of these statements.
| 58 CIGNA CORPORATION - 2017 Form 10-K | | |
PART II
ITEM 8. Financial Statements and Supplementary Data
Cigna Corporation |
| For the Years Ended December 31, |
|||||||||
| | | | | | | | | | |
| (In millions) | 2017 | 2016 | 2015 |
||||||
| | | | | | | | | | |
| Shareholders' net income | $ | 2,237 | $ | 1,867 | $ | 2,094 | |||
| | | | | | | | | | |
| Shareholders' other comprehensive income (loss), net of tax | |||||||||
| Net unrealized (depreciation) on securities | | (34) | | (56) | | (202) | |||
| Net unrealized (depreciation) appreciation on derivatives | (3) | (4) | 15 | ||||||
| Net translation of foreign currencies | | 304 | | (95) | | (212) | |||
| Postretirement benefits liability adjustment | 33 | 23 | 85 | ||||||
| | | | | | | | | | |
| Shareholders' other comprehensive income (loss), net of tax | | 300 | | (132) | | (314) | |||
| | | | | | | | | | |
| Shareholders' comprehensive income | 2,537 | 1,735 | 1,780 | ||||||
| | | | | | | | | | |
| Comprehensive income attributable to noncontrolling interests | | | | ||||||
| Net (loss) attributable to redeemable noncontrolling interests | – | (7) | (6) | ||||||
| Net (loss) attributable to other noncontrolling interests | | (5) | | (17) | | (11) | |||
| Other comprehensive (loss) attributable to redeemable noncontrolling interests | (3) | (10) | (17) | ||||||
| Other comprehensive (loss) attributable to other noncontrolling interests | | – | | – | | (1) | |||
| | | | | | | | | | |
| Total comprehensive (loss) attributable to noncontrolling interests | (8) | (34) | (35) | ||||||
| | | | | | | | | | |
| TOTAL COMPREHENSIVE INCOME | $ | 2,529 | $ | 1,701 | $ | 1,745 | |||
| | | | | | | | | | |
The accompanying Notes to the Consolidated Financial Statements are an integral part of these statements.
| | | CIGNA CORPORATION - 2017 Form 10-K 59 |
PART II
ITEM 8. Financial Statements and Supplementary Data
Cigna Corporation |
| As of December 31, |
||||||
| | | | | | | |
| (In millions, except per share amounts) | 2017 | 2016 |
||||
| | | | | | | |
| Assets | | | ||||
| Investments | ||||||
Fixed maturities, at fair value (amortized cost, $21,867; $19,942) |
$ | 23,138 | $ | 20,961 | ||
Equity securities, at fair value (cost, $589; $583) |
588 | 583 | ||||
Commercial mortgage loans |
| 1,761 | | 1,666 | ||
Policy loans |
1,415 | 1,452 | ||||
Other long-term investments |
| 1,518 | | 1,462 | ||
Short-term investments |
199 | 691 | ||||
| | | | | | | |
Total investments |
| 28,619 | | 26,815 | ||
| Cash and cash equivalents | 2,972 | 3,185 | ||||
| Premiums, accounts and notes receivable, net | | 3,380 | | 3,077 | ||
| Reinsurance recoverables | 6,046 | 6,478 | ||||
| Deferred policy acquisition costs | | 2,237 | | 1,818 | ||
| Property and equipment | 1,563 | 1,536 | ||||
| Deferred tax assets, net | | 33 | | 304 | ||
| Goodwill | 6,164 | 5,980 | ||||
| Other assets, including other intangibles | | 2,316 | | 2,227 | ||
| Separate account assets | 8,423 | 7,940 | ||||
| | | | | | | |
TOTAL ASSETS |
$ | 61,753 | $ | 59,360 | ||
| | | | | | | |
| Liabilities | ||||||
| Contractholder deposit funds | $ | 8,196 | $ | 8,458 | ||
| Future policy benefits | 10,040 | 9,648 | ||||
| Unpaid claims and claim expenses | | 5,168 | | 4,917 | ||
| Global Health Care medical costs payable | 2,719 | 2,532 | ||||
| Unearned premiums | | 724 | | 634 | ||
| | | | | | | |
Total insurance and contractholder liabilities |
26,847 | 26,189 | ||||
| Accounts payable, accrued expenses and other liabilities | | 7,260 | | 6,414 | ||
| Short-term debt | 240 | 276 | ||||
| Long-term debt | | 5,199 | | 4,756 | ||
| Separate account liabilities | 8,423 | 7,940 | ||||
| | | | | | | |
TOTAL LIABILITIES |
| 47,969 | | 45,575 | ||
| | | | | | | |
| Contingencies – Note 21 | ||||||
| Redeemable noncontrolling interests | | 49 | | 58 | ||
| Shareholders' equity | ||||||
| Common stock (par value per share, $0.25; shares issued, 296; authorized, 600) | | 74 | | 74 | ||
| Additional paid-in capital | 2,940 | 2,892 | ||||
| Accumulated other comprehensive loss | | (1,082) | | (1,382) | ||
| Retained earnings | 15,824 | 13,855 | ||||
| Less: treasury stock, at cost | | (4,021) | | (1,716) | ||
| | | | | | | |
TOTAL SHAREHOLDERS' EQUITY |
13,735 | 13,723 | ||||
| Noncontrolling interests | | – | | 4 | ||
| | | | | | | |
Total equity |
13,735 | 13,727 | ||||
| | | | | | | |
Total liabilities and equity |
$ | 61,753 | $ | 59,360 | ||
| | | | | | | |
| SHAREHOLDERS' EQUITY PER SHARE | $ | 56.30 | $ | 53.42 | ||
| | | | | | | |
The accompanying Notes to the Consolidated Financial Statements are an integral part of these statements.
| 60 CIGNA CORPORATION - 2017 Form 10-K | | |
PART II
ITEM 8. Financial Statements and Supplementary Data
Cigna Corporation |
| (In millions, except per share amounts) |
Common Stock |
Additional Paid-in Capital |
Accumulated Other Comprehensive Loss |
Retained Earnings |
Treasury Stock |
Shareholders' Equity |
Noncontrolling Interests |
Total Equity |
Redeemable Noncontrolling Interests |
||||||||||||||||||
|---|---|---|---|---|---|---|---|---|---|---|---|---|---|---|---|---|---|---|---|---|---|---|---|---|---|---|---|
| | | | | | | | | | | | | | | | | | | | | | | | | | | | |
| Balance at December 31, 2014 | $ | 74 | $ | 2,769 | $ | (936) | $ | 10,289 | $ | (1,422) | $ | 10,774 | $ | 15 | $ | 10,789 | $ | 90 | |||||||||
| 2015 Activity | |||||||||||||||||||||||||||
| Effect of issuing stock for employee benefit plans | | | | 99 | | | | (252) | | 336 | | 183 | | | | 183 | | | |||||||||
| Other comprehensive income (loss) | (314) | (314) | (1) | (315) | (17) | ||||||||||||||||||||||
| Net income (loss) | | | | | | | | 2,094 | | | | 2,094 | | (11) | | 2,083 | | (6) | |||||||||
| Common dividends declared (per share: $0.04) | (10) | (10) | (10) | ||||||||||||||||||||||||
| Repurchase of common stock | | | | | | | | | | (683) | | (683) | | | | (683) | | | |||||||||
| Other transactions impacting noncontrolling interests | (9) | (9) | 6 | (3) | 2 | ||||||||||||||||||||||
| | | | | | | | | | | | | | | | | | | | | | | | | | | | |
| Balance at December 31, 2015 | | 74 | | 2,859 | | (1,250) | | 12,121 | | (1,769) | | 12,035 | | 9 | | 12,044 | | 69 | |||||||||
| | | | | | | | | | | | | | | | | | | | | | | | | | | | |
| 2016 Activity | |||||||||||||||||||||||||||
| Effect of issuing stock for employee benefit plans | | | | 51 | | | | (123) | | 163 | | 91 | | | | 91 | | | |||||||||
| Other comprehensive income (loss) | (132) | (132) | (132) | (10) | |||||||||||||||||||||||
| Net income (loss) | | | | | | | | 1,867 | | | | 1,867 | | (17) | | 1,850 | | (7) | |||||||||
| Common dividends declared (per share: $0.04) | (10) | (10) | (10) | ||||||||||||||||||||||||
| Repurchase of common stock | | | | | | | | | | (110) | | (110) | | | | (110) | | | |||||||||
| Other transactions impacting noncontrolling interests | (18) | (18) | 12 | (6) | 6 | ||||||||||||||||||||||
| | | | | | | | | | | | | | | | | | | | | | | | | | | | |
| Balance at December 31, 2016 | | 74 | | 2,892 | | (1,382) | | 13,855 | | (1,716) | | 13,723 | | 4 | | 13,727 | | 58 | |||||||||
| | | | | | | | | | | | | | | | | | | | | | | | | | | | |
| 2017 Activity | |||||||||||||||||||||||||||
| Effect of issuing stock for employee benefit plans | | | 51 | | | | (258) | | 455 | | 248 | | | | 248 | | |||||||||||
| Other comprehensive income (loss) | 300 | 300 | 300 | (3) | |||||||||||||||||||||||
| Net income (loss) | | | | | | | 2,237 | | | | 2,237 | | (5) | | 2,232 | | – | ||||||||||
| Common dividends declared (per share: $0.04) | (10) | (10) | (10) | ||||||||||||||||||||||||
| Repurchase of common stock | | | | | | | | | (2,760) | | (2,760) | | | | (2,760) | | |||||||||||
| Other transactions impacting noncontrolling interests | (3) | (3) | 1 | (2) | (6) | ||||||||||||||||||||||
| | | | | | | | | | | | | | | | | | | | | | | | | | | | |
| Balance at December 31, 2017 | $ | 74 | $ | 2,940 | $ | (1,082) | $ | 15,824 | $ | (4,021) | $ | 13,735 | $ | – | $ | 13,735 | $ | 49 | |||||||||
| | | | | | | | | | | | | | | | | | | | | | | | | | | | |
The accompanying Notes to the Consolidated Financial Statements are an integral part of these statements.
| | | CIGNA CORPORATION - 2017 Form 10-K 61 |
PART II
ITEM 8. Financial Statements and Supplementary Data
Cigna Corporation |
| |
For the years ended December 31, |
||||||||
|---|---|---|---|---|---|---|---|---|---|
| | | | | | | | | | |
| (In millions) | 2017 | 2016 | 2015 | ||||||
| | | | | | | | | | |
| Cash Flows from Operating Activities | | | | ||||||
| Net income | $ | 2,232 | $ | 1,843 | $ | 2,077 | |||
| Adjustments to reconcile net income to net cash provided by operating activities: | | | | ||||||
Depreciation and amortization |
566 | 610 | 585 | ||||||
Realized investment (gains), net |
| (237) | | (169) | | (57) | |||
Deferred income taxes |
242 | 74 | 21 | ||||||
Net changes in assets and liabilities, net of non-operating effects: |
| | | ||||||
Premiums, accounts and notes receivable |
(233) | 663 | (945) | ||||||
Reinsurance recoverables |
| 214 | | 142 | | 55 | |||
Deferred policy acquisition costs |
(282) | (213) | (182) | ||||||
Other assets |
| (171) | | 134 | | 16 | |||
Insurance liabilities |
506 | 683 | 657 | ||||||
Accounts payable, accrued expenses and other liabilities |
| 639 | | 124 | | 423 | |||
Current income taxes |
92 | 1 | (25) | ||||||
Debt extinguishment costs |
| 321 | | – | | 100 | |||
Distributions from partnership investments (2) |
161 | 144 | 137 | ||||||
Other, net (1) |
| 36 | | (10) | | 71 | |||
| | | | | | | | | | |
| NET CASH PROVIDED BY OPERATING ACTIVITIES (1)(2) | 4,086 | 4,026 | 2,933 | ||||||
| | | | | | | | | | |
| Cash Flows from Investing Activities | | | | ||||||
| Proceeds from investments sold: | |||||||||
Fixed maturities and equity securities |
| 2,012 | | 1,544 | | 1,555 | |||
| Investment maturities and repayments: | |||||||||
Fixed maturities and equity securities |
| 2,051 | | 1,755 | | 1,435 | |||
Commercial mortgage loans |
335 | 316 | 640 | ||||||
| Other sales, maturities and repayments (primarily short-term and other long-term investments) (2) | | 1,702 | | 1,431 | | 1,160 | |||
| Investments purchased or originated: | |||||||||
Fixed maturities and equity securities |
| (5,628) | | (5,191) | | (4,234) | |||
Commercial mortgage loans |
(430) | (165) | (500) | ||||||
Other (primarily short-term and other long-term investments) |
| (1,065) | | (1,698) | | (1,183) | |||
| Property and equipment purchases, net | (471) | (461) | (510) | ||||||
| Acquisitions, net of cash acquired | | (209) | | (4) | | (99) | |||
| Other, net | – | (101) | – | ||||||
| | | | | | | | | | |
| NET CASH (USED IN) INVESTING ACTIVITIES (2) | | (1,703) | | (2,574) | | (1,736) | |||
| | | | | | | | | | |
| Cash Flows from Financing Activities | |||||||||
| Deposits and interest credited to contractholder deposit funds | | 1,230 | | 1,460 | | 1,429 | |||
| Withdrawals and benefit payments from contractholder deposit funds | (1,363) | (1,362) | (1,359) | ||||||
| Net change in short-term debt | | 80 | | (148) | | (21) | |||
| Payments for debt extinguishment | (313) | – | (87) | ||||||
| Repayment of long-term debt | | (1,250) | | – | | (851) | |||
| Net proceeds on issuance of long-term debt | 1,581 | – | 894 | ||||||
| Repurchase of common stock | | (2,725) | | (139) | | (671) | |||
| Issuance of common stock | 131 | 36 | 154 | ||||||
| Other, net (1) | | (22) | | (72) | | (97) | |||
| | | | | | | | | | |
| NET CASH (USED IN) FINANCING ACTIVITIES (1) | (2,651) | (225) | (609) | ||||||
| | | | | | | | | | |
| Effect of foreign currency rate changes on cash and cash equivalents | | 55 | | (10) | | (40) | |||
| | | | | | | | | | |
| Net (decrease) increase in cash and cash equivalents | (213) | 1,217 | 548 | ||||||
| Cash and cash equivalents, January 1, | | 3,185 | | 1,968 | | 1,420 | |||
| | | | | | | | | | |
| Cash and cash equivalents, December 31, | $ | 2,972 | $ | 3,185 | $ | 1,968 | |||
| | | | | | | | | | |
| Supplemental Disclosure of Cash Information: | | | | ||||||
Income taxes paid, net of refunds |
$ | 1,036 | $ | 1,064 | $ | 1,194 | |||
Interest paid |
$ | 240 | $ | 244 | $ | 245 | |||
| | | | | | | | | | |
The accompanying Notes to the Consolidated Financial Statements are an integral part of these statements.
| 62 CIGNA CORPORATION - 2017 Form 10-K | | |
PART II
ITEM 8. Financial Statements and Supplementary Data
Notes to the Consolidated Financial Statements |
Table of Contents
| | | CIGNA CORPORATION - 2017 Form 10-K 63 |
PART II
ITEM 8. Financial Statements and Supplementary Data
NOTE 1 Description of Business |
Cigna Corporation, together with its subsidiaries (either individually or collectively referred to as "Cigna," the "Company," "we," "our" or "us") is a global health services organization dedicated to a mission of helping individuals improve their health, well-being and sense of security. To execute on our mission, Cigna's evolved strategy is to "Go Deeper", "Go Local" and "Go Beyond" with a differentiated set of medical, dental, disability, life and accident insurance and related products and services offered by our subsidiaries. The majority of these products are offered through employers and other groups such as governmental and non-governmental organizations, unions and associations. Cigna also offers commercial health and dental insurance, Medicare and Medicaid products and health, life and accident insurance coverages to individuals in the United States and selected international markets. In addition to these ongoing operations, Cigna also has certain run-off operations.
The financial results of the Company's businesses are reported in the following segments:
Global Health Care aggregates the Commercial and Government operating segments due to their similar economic characteristics, products and services and regulatory environment:
Global Supplemental Benefits includes supplemental health, life and accident insurance products offered in selected international markets and in the United States.
Group Disability and Life provides group long-term and short-term disability, group life, accident and specialty insurance products and related services.
Other Operations consist of:
Corporate reflects amounts not allocated to operating segments, including net interest expense (defined as interest on corporate debt less net investment income on investments not supporting segment operations), interest on uncertain tax positions, certain litigation matters, intersegment eliminations, compensation cost for stock options and related excess tax benefits, expense associated with our frozen pension plans and certain overhead and project costs.
NOTE 2 Summary of Significant Accounting Policies |
Basis of Presentation |
The Consolidated Financial Statements include the accounts of Cigna Corporation and its subsidiaries. Intercompany transactions and accounts have been eliminated in consolidation. These Consolidated Financial Statements were prepared in conformity with accounting principles generally accepted in the United States of America ("GAAP"). Amounts recorded in the Consolidated Financial Statements necessarily reflect management's estimates and assumptions about medical costs, investment valuation, interest rates and other factors. Significant estimates are discussed throughout these Notes; however, actual results could differ from those estimates. The impact of a change in estimate is generally included in earnings in the period of adjustment. Certain reclassifications have been made to prior year amounts to conform to the current presentation.
Variable interest entities. See Note 13 for a discussion of consolidated variable interest entities.
| 64 CIGNA CORPORATION - 2017 Form 10-K | | |
PART II
ITEM 8. Financial Statements and Supplementary Data
Recent Accounting Guidance |
The following tables provide information about recently adopted accounting guidance and accounting guidance not yet adopted that is applicable to Cigna.
Recently Adopted Accounting Guidance
| | | | | | | | | |
| Accounting Standard and Adoption Date | | Effects of Adopting New Guidance | | |||||
| | | | | | | | | |
| GUIDANCE ADOPTED IN 2017 | ||||||||
| | | | | | | | | |
| Securities and Exchange Commission ("SEC") Staff Accounting Bulletin No. 118 ("SAB 118"), adopted December 31, 2017 |
Guidance:
• Allows a company to recognize the effects of U.S. tax reform as provisional in its 2017 financial statements when it does not have the necessary information in reasonable detail to complete its accounting for the change in tax law.
• Establishes a maximum one-year measurement period that ends when a company has obtained the information necessary to finalize its accounting. During the measurement period, adjustments for the effects of the law will be recorded to the extent a reasonable estimate for all or a portion of the effects of the law can be made. Effects of adoption: • The Company has reported reasonable estimates of the income tax effects of U.S. tax reform as provisional in its financial statements. • See Note 20 for disclosures about the impact of U.S. tax reform on the Company's financial statements. |
|||||||
| | | | | | | | | |
Accounting Guidance Not Yet Adopted
| | | | | | | | | |
| Accounting Standard and Effective Date Applicable for Cigna | | Requirements and Expected Effects of New Guidance Not Yet Adopted | | |||||
| | | | | | | | | |
| GUIDANCE TO BE ADOPTED JANUARY 1, 2018 | ||||||||
| | | | | | | | | |
| Revenue from Contracts with Customers (Accounting Standards Update ("ASU") 2014-09 and related amendments) Required as of January 1, 2018 |
Requires:
• Companies to estimate and allocate the expected customer contract revenues among distinct goods or services based on relative standalone selling prices • Revenues to be recognized as goods or services are delivered • New disclosures including presenting relevant categories of revenues and information about related contract assets and liabilities • Adoption through retrospective restatement with or without using certain practical expedients or adoption with a cumulative effect adjustment Expected effects: • Guidance applies to the Company's administrative service, mail order pharmacy and other non-insurance contracts, but does not apply to certain contracts within the scope of other GAAP, such as the Company's insurance and investment contracts accounted for under the Financial Accounting Standards Board's Accounting Standards Codification ("ASC") 944. • The Company has completed its evaluation of the new requirements and the adoption of the new guidance will not have a material impact to its pattern of revenue recognition or net income. • The Company will adopt the new guidance through retrospective restatement and is currently working to develop required disclosures and restate historical periods in line with its chosen method of adoption. The Company does not anticipate significant changes to its systems, processes or controls. • The Company's cumulative effect of implementing this guidance will result in an immaterial decrease to the opening balance of retained earnings from establishing a contract liability for service fee revenue that must be recognized when services are provided after the termination of certain administrative service contracts. • The Company also will reclassify certain fees as a result of clarifications in the new guidance and its related interpretations. |
|||||||
| | | | | | | | | |
| | | CIGNA CORPORATION - 2017 Form 10-K 65 |
PART II
ITEM 8. Financial Statements and Supplementary Data
| | | | | | | | | |
| Accounting Standard and Effective Date Applicable for Cigna | | Requirements and Expected Effects of New Guidance Not Yet Adopted | | |||||
| | | | | | | | | |
| GUIDANCE TO BE ADOPTED JANUARY 1, 2018 | ||||||||
| | | | | | | | | |
| Recognition and Measurement of Financial Assets and Financial Liabilities (ASU 2016-01) Required as of January 1, 2018 |
Requires:
• Entities to measure equity investments at fair value in net income if they are neither consolidated nor accounted for under the equity method • Cumulative effect adjustment to the beginning balance of retained earnings at adoption Expected effects: • Certain limited partnership interests carried at cost of approximately $200 million as of December 31, 2017 will be reported at fair value at adoption with future changes in fair value reported in net investment income. • Changes in fair value for equity securities previously reported in accumulated other comprehensive income will now be reported in net realized investment gains. • Retained earnings will increase by approximately $60 million after-tax on January 1, 2018. |
|||||||
| | | | | | | | | |
| Intra-Entity Asset Transfers of Assets Other than Inventory (ASU 2016-16) Required as of January 1, 2018 |
Requires:
• Entities to recognize the tax impacts of all intra-entity sales of assets other than inventory even though the pre-tax effects of those transactions are eliminated in consolidation • Modified retrospective approach for adoption with a cumulative-effect adjustment recorded in retained earnings Expected effects: the adoption of this standard will not have a material effect on the Company's financial statements. |
|||||||
| | | | | | | | | |
| Clarifying the Definition of a Business (ASU 2017-01) Required as of January 1, 2018 |
Guidance:
• Revises the definition of a business and provides a more robust framework for entities to use in determining when a set of assets and activities is a business. • Requires entities to apply this new definition to business transactions beginning in the first quarter of 2018. Expected effects: the Company does not expect this change in definition will have a material impact on its financial statements. |
|||||||
| | | | | | | | | |
| Improving the Presentation of Net Periodic Pension Cost and Net Periodic Postretirement Benefit Cost (ASU 2017-07) Required as of January 1, 2018 |
Requires:
• Employers to separate the service cost component from the other components of net benefit cost • Only service cost is eligible for capitalization (as either deferred policy acquisition costs or capitalized software), to be applied prospectively upon adoption • Income statement captions used for each component of net benefit cost to be disclosed Expected effects: the Company does not expect the effect of this new guidance to be material to results of operations because its most significant plans are frozen. See Note 15 for additional information. |
|||||||
| | | | | | | | | |
| GUIDANCE TO BE EARLY ADOPTED JANUARY 1, 2018 | ||||||||
| | | | | | | | | |
| Targeted Improvements to Accounting for Hedging Activities (ASU 2017-12) Required as of January 1, 2019, with early adoption permitted in 2017 |
Guidance:
• Relaxes requirements for financial and nonfinancial hedging strategies to be eligible for hedge accounting and changes how companies assess effectiveness. • Amends presentation and disclosure requirements to improve transparency about the uses and results of hedging programs. Expected effects: the Company is planning to adopt this guidance on January 1, 2018 with an immaterial impact to its financial statements for existing hedges. |
|||||||
| | | | | | | | | |
| GUIDANCE TO BE ADOPTED AFTER 2018 OR ADOPTION DATE HAS NOT BEEN DETERMINED | ||||||||
| | | | | | | | | |
| Reclassification of Certain Tax Effects from Accumulated Other Comprehensive Income (ASU 2018-02) Effective as of January 1, 2019 with early adoption permitted for reporting periods for which financials have not been issued. |
Guidance:
• Allows companies to reclassify tax effects stranded in accumulated other comprehensive income as a result of U.S. tax reform to retained earnings. • Requires additional disclosures of the company's accounting policy for releasing income tax effects from accumulated other comprehensive income. • Allows companies to apply the guidance retrospectively or in the period of adoption. Effects of adoption: • The Company is evaluating this new standard and its expected timing of adoption. • If adopted as of December 31, 2017, approximately $230 million of accumulated other comprehensive income would have been reclassified to retained earnings. |
|||||||
| | | | | | | | | |
| 66 CIGNA CORPORATION - 2017 Form 10-K | | |
PART II
ITEM 8. Financial Statements and Supplementary Data
| | | | | | | | | |
| Accounting Standard and Effective Date Applicable for Cigna | | Requirements and Expected Effects of New Guidance Not Yet Adopted | | |||||
| | | | | | | | | |
| GUIDANCE TO BE ADOPTED AFTER 2018 OR ADOPTION DATE HAS NOT BEEN DETERMINED | ||||||||
| | | | | | | | | |
| Leases (ASU 2016-02) Required as of January 1, 2019 |
Requires:
• Balance sheet recognition of assets and liabilities arising from leases, including leases embedded in other contracts • Additional disclosures of the amount, timing and uncertainty of cash flows from leases will be required • Modified retrospective approach for leases in effect as of and after the date of adoption with a cumulative-effect adjustment recorded in retained earnings Expected effects: • The Company is continuing to evaluate the impact this standard will have on its financial statements. • While not yet quantified, the Company expects a material impact to the Consolidated Balance Sheets from recognizing additional assets and liabilities of operating leases upon adoption. The actual increase in assets and liabilities will depend on the volume and terms of leases in place at the time of adoption. • The Company is implementing a new lease system in connection with the adoption. |
|||||||
| | | | | | | | | |
| Measurement of Credit Losses on Financial Instruments (ASU 2016-13) Required as of January 1, 2020, with early adoption permitted as of January 1, 2019 |
Requires:
• A new approach using expected credit losses to estimate and recognize credit losses for certain financial instruments such as mortgage loans, reinsurance recoverables and other receivables • Changes in the criteria for impairment of available-for-sale debt securities • Adoption using a modified retrospective approach with a cumulative-effect adjustment recorded in retained earnings Expected effects: • The Company is evaluating this new standard, its expected timing of adoption and effects on its financial statements and disclosures. • An additional allowance for future expected credit losses for certain financial instruments may be required at adoption. |
|||||||
| | | | | | | | | |
| Simplifying the Test for Goodwill Impairment (ASU 2017-04) Required as of January 1, 2020, with early adoption permitted as of January 1, 2017 |
Guidance:
• Simplifies the accounting for goodwill impairment by eliminating the need to determine the fair value of individual assets and liabilities of a reporting unit to measure a goodwill impairment. • Redefines the amount of goodwill impairment to be equal to the amount by which a reporting unit's carrying value exceeds its fair value, limited to the total amount of goodwill of the reporting unit. • Requires prospective adoption. Expected effects: the Company is evaluating this new standard and its expected timing of adoption. |
|||||||
| | | | | | | | | |
| | | CIGNA CORPORATION - 2017 Form 10-K 67 |
PART II
ITEM 8. Financial Statements and Supplementary Data
Significant Accounting Policies |
The Company's accounting policies are described either in this Note or in the applicable Notes to the Consolidated Financial Statements as indicated in the table below.
A. Investments – Policy Loans |
Policy loans are carried at unpaid principal balances plus accumulated interest, the total of which approximates fair value. These loans are collateralized by life insurance policy cash values and therefore have minimal exposure to credit loss. Interest rates are reset annually based on a rolling average of benchmark interest rates.
B. Cash and Cash Equivalents |
Cash and cash equivalents are carried at cost that approximates fair value. Cash equivalents consist of short-term investments with maturities of three months or less from the time of purchase. The Company reclassifies cash overdraft positions to accounts payable, accrued expenses and other liabilities when the legal right of offset does not exist.
C. Premiums, Accounts and Notes Receivable and Reinsurance Recoverables |
Premiums, accounts and notes receivable and reinsurance recoverables are reported net of allowances for doubtful accounts and unrecoverable reinsurance of $210 million as of December 31, 2017 and $ 203 million as of December 31, 2016. The Company estimates these allowances for doubtful accounts and unrecoverable reinsurance using management's best estimates of collectability, taking into consideration the age of the outstanding amounts, historical collection patterns and other economic factors. See Note 22 for additional discussion of the allowance established in 2016 for the risk corridor receivable.
D. Deferred Policy Acquisition Costs |
Costs eligible for deferral include incremental, direct costs of acquiring new or renewal insurance and investment contracts and other costs directly related to successful contract acquisition. Examples of deferrable costs include commissions, sales compensation and benefits, policy
| 68 CIGNA CORPORATION - 2017 Form 10-K | | |
PART II
ITEM 8. Financial Statements and Supplementary Data
issuance and underwriting costs and premium taxes. The Company records acquisition costs differently depending on the product line. Acquisition costs for:
Deferred policy acquisition costs also include the value of business acquired for certain acquisitions with material long-duration insurance contracts. The Company recorded amortization of deferred policy acquisition costs of $322 million in 2017, $292 million in 2016 and $286 million in 2015 primarily in other operating expenses.
Each year, deferred policy acquisition costs are tested for recoverability. For universal life and other individual products, management estimates the present value of future revenues less expected payments. For group health and accident insurance products, management estimates the sum of unearned premiums and anticipated net investment income less future expected claims and related costs. If management's estimates of these sums are less than the deferred costs, the Company reduces deferred policy acquisition costs and records an additional expense.
E. Other Assets, including Other Intangibles |
Other assets, including other intangibles consist primarily of GMIB assets, accrued net investment income, other intangible assets and various other insurance-related assets. See Note 9 for the Company's accounting policy for GMIB assets and see Note 17 for the Company's accounting policy for other intangibles. Additionally, these other assets include the carrying value of our equity-method investments in joint ventures in China, India (as of 2017) and other foreign jurisdictions.
F. Contractholder Deposit Funds |
Liabilities for contractholder deposit funds primarily include deposits received from customers for investment-related and universal life products and investment earnings on their fund balances. These liabilities are adjusted to reflect administrative charges and, for universal life fund balances, mortality charges. In addition, this caption includes: 1) premium stabilization reserves under group insurance contracts representing experience refunds left with the Company to pay future premiums; 2) deposit administration funds used to fund non-pension retiree insurance programs; 3) retained asset accounts; and 4) annuities or supplementary contracts without significant life contingencies. Interest credited on these funds is accrued ratably over the contract period.
G. Future Policy Benefits |
Future policy benefits represent the present value of estimated future obligations under long-term life and supplemental health insurance policies and annuity products currently in force. These obligations are estimated using actuarial methods and consist primarily of reserves for annuity contracts, life insurance benefits, GMDB contracts (see Note 9 for additional information) and certain health, life and accident insurance products of our Global Supplemental Benefits segment.
Obligations for annuities represent specified periodic benefits to be paid to an individual or groups of individuals over their remaining lives. Obligations for life insurance policies and GMDB contracts represent benefits expected to be paid to policyholders, net of future premiums expected to be received. Management estimates these obligations based on assumptions as to premiums, interest rates, mortality or morbidity, future claim adjudication expenses and surrenders, allowing for adverse deviation as appropriate. Mortality, morbidity and surrender assumptions are based on the Company's own experience and published actuarial tables. Interest rate assumptions are based on management's judgment considering the Company's experience and future expectations, and range from 0.1% to 9%. Obligations for the run-off settlement annuity business include adjustments for realized and unrealized investment returns consistent with GAAP when a premium deficiency exists.
H. Redeemable Noncontrolling Interests |
Products and services are offered in Turkey and India through joint venture entities. The Company is the principal equity holder and primary beneficiary of the Turkey joint venture and accordingly, this entity is consolidated. In 2017, Cigna modified the agreement governing its joint venture in India due to changes in the local regulatory environment that require control by a local partner. As a result of the changes in the joint venture agreement, the Company determined that it is no longer the primary beneficiary of the joint venture and, effective with the third quarter of 2017, no longer consolidates its results.
As of December 31, 2017 the redeemable noncontrolling interests on our Consolidated Balance Sheets represent the Turkey joint venture partner's preferred and common stock interests in the entity. Our joint venture partner may, at their election, require the Company to purchase their redeemable noncontrolling interests. We also have the right to require our joint venture partner to sell their redeemable noncontrolling interests to us. The redeemable noncontrolling interests were recorded at fair value as of the dates of purchase. When the estimated redemption value for a redeemable noncontrolling interest exceeds its carrying value, an adjustment to increase the redeemable noncontrolling interest is recorded with an offsetting reduction to additional paid-in capital. When an adjustment is made to the carrying value of the redeemable noncontrolling interest, the calculation of shareholders' net income per share will be adjusted if the redemption value exceeds the greater of the carrying value or fair value.
| | | CIGNA CORPORATION - 2017 Form 10-K 69 |
PART II
ITEM 8. Financial Statements and Supplementary Data
I. Accounts Payable, Accrued Expenses and Other Liabilities |
Accounts payable, accrued expenses and other liabilities include liabilities for pension, other postretirement and postemployment benefits (see Note 15), GMIB contract liabilities (see Note 9), self-insured exposures, management compensation, cash overdraft positions and various insurance-related liabilities, including experience-rated refunds, reinsurance contracts and the risk adjustment and minimum medical loss ratio rebate accruals under The Patient Protection and Affordable Care Act (the "ACA"). Legal costs to defend the Company's litigation and arbitration matters are expensed when incurred in cases where the Company cannot reasonably estimate the ultimate cost to defend. In cases where the Company can reasonably estimate the cost to defend, a liability for these costs is accrued when the claim is reported.
J. Translation of Foreign Currencies |
The Company generally conducts its international business through foreign operating entities that maintain assets and liabilities in local currencies that are generally their functional currencies. The Company uses exchange rates as of the balance sheet date to translate assets and liabilities into U.S. dollars. Translation gains or losses on functional currencies, net of applicable taxes, are recorded in accumulated other comprehensive income (loss). The Company uses average monthly exchange rates during the year to translate revenues and expenses into U.S. dollars.
K. Premiums and Related Expenses |
Premiums for group life, accident and health insurance and managed care coverages are recognized as revenue on a pro rata basis over the contract period. Benefits and expenses are recognized when incurred and, for our Global Health Care insured business, medical costs are presented net of pharmaceutical manufacturer rebates. For experience-rated contracts, premium revenue includes an adjustment for experience-rated refunds based on contract terms and calculated using the customer's experience (including estimates of incurred but not reported claims).
Premium revenue also includes an adjustment to reflect the estimated effect of rebates due to customers under the commercial minimum medical loss ratio provisions of the ACA. These rebates are settled in the year following the policy year.
Premiums received for the Company's Medicare Advantage Plans and Medicare Part D products from the Centers for Medicare and Medicaid Services ("CMS") and customers are recognized as revenue ratably over the contract period. CMS provides risk-adjusted premium payments for Medicare Advantage Plans and Medicare Part D products based on the demographics and wellness of enrollees. The Company recognizes periodic changes to risk-adjusted premiums as revenue when the amounts are determinable and collection is reasonably assured. Additionally, Medicare Part D premiums include payments from CMS for risk sharing adjustments. The risk sharing adjustments are estimated quarterly based on claim experience by comparing actual incurred drug benefit costs to estimated costs submitted in original contracts. These adjustments may result in more or less revenue from CMS. Final revenue adjustments are determined and settled with CMS in the year following the contract year. Premium revenue also includes an adjustment to reflect the estimated effect of rebates due to CMS under the Medicare Advantage and Medicare Part D minimum medical loss ratio provisions of the ACA.
The ACA prescribed three programs to mitigate the risk for participating health insurance companies selling coverage on the public exchanges: risk adjustment, reinsurance and risk corridor. The reinsurance and risk corridor programs expired at the end of 2016, while the permanent risk adjustment program continues. A summary of these programs and the Company's accounting policy is provided below.
Premiums for individual life, accident and supplemental health insurance and annuity products, excluding universal life and investment-related products, are recognized as revenue when due. Benefits and expenses are matched with premiums.
Revenue for universal life products is recognized as follows:
Benefits and expenses for universal life products consist of benefit claims in excess of policyholder account balances and income earned by policyholders. Expenses are recognized when claims are incurred, and income is credited to policyholders in accordance with contract provisions.
The unrecognized portion of premiums received is recorded as unearned premiums.
| 70 CIGNA CORPORATION - 2017 Form 10-K | | |
PART II
ITEM 8. Financial Statements and Supplementary Data
L. Fees, Related Expenses and Mail Order Pharmacy Revenues and Costs |
Contract fees for administrative services only ("ASO") programs and pharmacy programs and services are recognized in fees and other revenues as services are provided, net of estimated pharmaceutical manufacturer rebates payable to ASO clients using our network of retail pharmacies and estimated refunds under performance guarantees. Expenses associated with these programs and services are recognized in other operating expenses as incurred, net of estimated pharmaceutical rebates from manufacturers for prescriptions filled through our network of retail pharmacies.
In some cases, the Company provides performance guarantees associated with meeting certain service standards, clinical outcomes or financial metrics. If these service standards, clinical outcomes or financial metrics are not met, the Company may be financially at risk up to a stated percentage of the contracted fees or a stated dollar amount. The Company defers revenues for estimated payouts associated with these performance guarantees. Approximately 11% of ASO fees reported for the year ended December 31, 2017 were at risk under performance guarantees, with reimbursements estimated to be less than 1% of revenues.
Revenues for investment-related products are recognized as follows:
Benefits and expenses for investment-related products consist primarily of income credited to policyholders in accordance with contract provisions.
Mail order pharmacy revenues and the cost of prescriptions are recognized as each prescription is shipped. Mail order pharmacy revenues are presented net of estimated pharmaceutical manufacturer rebates payable to ASO clients using our mail order business. Mail order pharmacy costs include the cost of prescriptions sold and other costs to operate this business including supplies, shipping and handling, net of estimated pharmaceutical rebates from manufacturers for prescriptions filled through our mail order business.
NOTE 3 Mergers, Acquisitions and Dispositions |
The following table presents transaction-related costs incurred by the Company for the years ended December 31, 2017, 2016 and 2015. Transaction-related costs primarily consist of fees for legal, advisory and other professional services as well as employee costs. In addition, because the merger with Anthem, Inc. ("Anthem") was not consummated, certain transaction-related costs that were previously not deductible for federal income tax purposes became deductible. The Company recognized an incremental tax benefit for these newly deductible costs in 2017 as presented below.
| |
2017 |
2016 |
2015 |
||||||||||||||||
|---|---|---|---|---|---|---|---|---|---|---|---|---|---|---|---|---|---|---|---|
| |
|||||||||||||||||||
| (In millions) |
Before-tax |
After-tax |
Before-tax |
After-tax |
Before-tax |
After-tax |
|||||||||||||
| | | | | | | | | | | | | | | | | | | | |
| Transaction-related costs | $ | 126 | $ | 92 | $ | 166 | $ | 147 | $ | 66 | $ | 57 | |||||||
| Tax (benefit) – previously non-deductible costs | – | (59 | ) | – | – | – | – | ||||||||||||
| | | | | | | | | | | | | | | | | | | | |
| Transaction-related costs, net | $ | 126 | $ | 33 | $ | 166 | $ | 147 | $ | 66 | $ | 57 | |||||||
| | | | | | | | | | | | | | | | | | | | |
NOTE 4 Earnings Per Share ("EPS") |
Accounting policy. The Company computes basic earnings per share using the weighted-average number of unrestricted common and deferred shares outstanding. Diluted earnings per share also includes the dilutive effect of outstanding employee stock options and restricted stock using the treasury stock method and the effect of strategic performance shares.
Basic and diluted earnings per share were computed as follows:
| |
2017 |
2016 |
2015 |
|||||||||||||||||||||||||
|---|---|---|---|---|---|---|---|---|---|---|---|---|---|---|---|---|---|---|---|---|---|---|---|---|---|---|---|---|
| |
||||||||||||||||||||||||||||
| (Shares in thousands, dollars in millions, except per share amounts) |
Basic |
Effect of Dilution |
Diluted |
Basic |
Effect of Dilution |
Diluted |
Basic |
Effect of Dilution |
Diluted |
|||||||||||||||||||
| | | | | | | | | | | | | | | | | | | | | | | | | | | | | |
| Shareholders' net income | $ | 2,237 | $ | – | $ | 2,237 | $ | 1,867 | $ | – | $ | 1,867 | $ | 2,094 | $ | – | $ | 2,094 | ||||||||||
| | | | | | | | | | | | | | | | | | | | | | | | | | | | | |
| Shares | ||||||||||||||||||||||||||||
Weighted average |
| 250,892 | | – | | 250,892 | | 255,360 | | – | | 255,360 | | 256,149 | | – | | 256,149 | ||||||||||
Common stock equivalents |
4,180 | 4,180 | 4,287 | 4,287 | 4,443 | 4,443 | ||||||||||||||||||||||
| | | | | | | | | | | | | | | | | | | | | | | | | | | | | |
| Total shares | | 250,892 | | 4,180 | | 255,072 | | 255,360 | | 4,287 | | 259,647 | | 256,149 | | 4,443 | | 260,592 | ||||||||||
| | | | | | | | | | | | | | | | | | | | | | | | | | | | | |
| EPS | $ | 8.92 | $ | (0.15 | ) | $ | 8.77 | $ | 7.31 | $ | (0.12 | ) | $ | 7.19 | $ | 8.17 | $ | (0.13 | ) | $ | 8.04 | |||||||
| | | | | | | | | | | | | | | | | | | | | | | | | | | | | |
The following outstanding employee stock options were not included in the computation of diluted earnings per share because their effect was anti-dilutive.
| (In millions) | 2017 | 2016 | 2015 |
|||||||
| | | | | | | | | | | |
| Anti-dilutive options | | 0.9 | | 2.3 | | 0.4 | ||||
| | | | | | | | | | | |
| | | CIGNA CORPORATION - 2017 Form 10-K 71 |
PART II
ITEM 8. Financial Statements and Supplementary Data
The outstanding amounts of debt and capital leases for the years ended December 31 were as follows:
| (In millions) | 2017 | 2016 |
||||
| | | | | | | |
| Short-term debt | | | ||||
Commercial paper |
$ | 100 | $ | – | ||
Current maturities of long-term debt |
| 131 | | 250 | ||
Other, including capital leases |
9 | 26 | ||||
| | | | | | | |
| Total short-term debt | $ | 240 | $ | 276 | ||
| | | | | | | |
| Long-term uncollateralized debt | ||||||
$131 million, 6.35% Notes due 2018 |
$ | – | $ | 131 | ||
$250 million, 4.375% Notes due 2020 (1) |
249 | 252 | ||||
$300 million, 5.125% Notes due 2020 (1) |
| 299 | | 301 | ||
$78 million, 6.37% Notes due 2021 |
78 | 78 | ||||
$300 million, 4.5% Notes due 2021 (1) |
| 299 | | 302 | ||
$750 million, 4% Notes due 2022 |
745 | 744 | ||||
$100 million, 7.65% Notes due 2023 |
| 100 | | 100 | ||
$17 million, 8.3% Notes due 2023 |
17 | 17 | ||||
$900 million, 3.25% Notes due 2025 |
| 894 | | 893 | ||
$600 million, 3.05% Notes due 2027 |
594 | – | ||||
$259 million, 7.875% Debentures due 2027 (2) |
| 258 | | 299 | ||
$45 million, 8.3% Step Down Notes due 2033 (2) |
45 | 82 | ||||
$191 million, 6.15% Notes due 2036 (2) |
| 190 | | 498 | ||
$121 million, 5.875% Notes due 2041 (2) |
119 | 296 | ||||
$317 million, 5.375% Notes due 2042 (2) |
| 315 | | 743 | ||
$1,000 million, 3.875% Notes due 2047 |
988 | – | ||||
Other, including capital leases |
| 9 | | 20 | ||
| | | | | | | |
| Total long-term debt | $ | 5,199 | $ | 4,756 | ||
| | | | | | | |
In the third quarter of 2017, the Company entered into two significant debt transactions: the issuance of new debt and a cash tender offer to retire a portion of outstanding debt. These transactions are described in more detail below.
On September 14, 2017, the Company issued new long-term debt as follows:
| (In millions) Debt Instrument |
Principal |
Term |
Maturity |
Stated Interest Rate |
Effective Interest Rate |
Amount net of discount and fees |
Interest payment dates |
|||||||||||||
|---|---|---|---|---|---|---|---|---|---|---|---|---|---|---|---|---|---|---|---|---|
| | | | | | | | | | | | | | | | | | | | | |
| 10-Year Notes | $ | 600 | | 10-Year | | October 15, 2027 | | 3.05 | % | | 3.183 | % | $ | 594 | April 15 and October 15 | |||||
| 30-Year Notes | $ | 1,000 | 30-Year | October 15, 2047 | 3.875 | % | 3.951 | % | $ | 987 | April 15 and October 15 | |||||||||
| | | | | | | | | | | | | | | | | | | | | |
The proceeds of this debt were mainly used to pay the consideration for the cash tender offer as described below. The Company intends to use the remaining proceeds for general corporate purposes, including the maturity of its Notes due in 2018.
At any time prior to July 15, 2027 (three months prior to the maturity date of the 10-Year Notes) or April 15, 2047 (six months prior to the maturity date of the 30-Year Notes), the Company may redeem the 10-Year Notes or the 30-Year Notes, in whole or in part, with accrued and unpaid interest, at a redemption price equal to the greater of:
In the third quarter of 2017, the Company completed a cash tender offer to purchase $1.0 billion of aggregate principal amount of certain of its outstanding debt securities. The Company recorded a pre-tax loss of $321 million ($209 million after-tax), consisting primarily of premium payments on the tender.
During the first quarter of 2017, the Company repaid $250 million of long-term notes that had matured.
In April 2015, the Company redeemed two of its outstanding notes early. The Company paid $955 million, including accrued interest and expenses that resulted in a pre-tax loss on early debt extinguishment of $100 million ($65 million after-tax).
In December 2017, the Company entered into an updated revolving credit and letter of credit agreement. This agreement extends through December 2022 and is diversified among 15 banks. Under this agreement, the Company can borrow up to $1.5 billion for general corporate purposes, of which up to $500 million can be used for letters of credit. The credit agreement includes options to increase the commitment amount to $2 billion and to extend the term past December 2022, subject to consent by the lenders. The agreement contains customary covenants and restrictions, including a financial covenant that the Company may not permit its leverage ratio – total consolidated debt to total consolidated capitalization (each as defined in the credit agreement) – to be greater than 50%. The Company was in compliance with its debt covenants as of December 31, 2017.
| 72 CIGNA CORPORATION - 2017 Form 10-K | | |
PART II
ITEM 8. Financial Statements and Supplementary Data
As of December 31, 2017, the Company had $9.3 billion of borrowing capacity within the maximum debt leverage covenant in the credit agreement, in addition to $5.4 billion of debt outstanding. The Company had $11 million of letters of credit outstanding as of December 31, 2017.
Maturities of long-term debt and capital leases are as follows:
| Scheduled Maturities |
||||||
| | | | | | | |
| (In millions) | Long-term Debt (1) |
Capital Leases |
||||
| | | | | | | |
| 2018 | $ | 131 | $ | 9 | ||
| 2019 | $ | – | $ | 8 | ||
| 2020 | $ | 550 | $ | 1 | ||
| 2021 | $ | 378 | $ | – | ||
| 2022 | $ | 750 | $ | – | ||
| Maturities after 2022 | $ | 3,550 | $ | – | ||
| | | | | | | |
Interest expense on long-term and short-term debt was $243 million in 2017, $251 million in 2016, and $252 million in 2015. These amounts exclude losses on the early extinguishment of debt.
NOTE 6 Common and Preferred Stock |
As of December 31, the Company had issued the following shares:
| (Shares in thousands) | 2017 | 2016 | 2015 |
||||||
| | | | | | | | | | |
| Common: Par value $0.25; 600,000 shares authorized | | | | ||||||
Outstanding – January 1, |
256,869 | 256,544 | 259,276 | ||||||
Issued for stock option exercises and other benefit plans |
| 2,761 | | 1,110 | | 2,751 | |||
Repurchased common stock |
(15,663) | (785) | (5,483) | ||||||
| | | | | | | | | | |
Outstanding – December 31, |
| 243,967 | | 256,869 | | 256,544 | |||
Treasury stock |
52,178 | 39,276 | 39,601 | ||||||
| | | | | | | | | | |
| Issued – December 31, | | 296,145 | | 296,145 | | 296,145 | |||
| | | | | | | | | | |
The Company maintains a share repurchase program authorized by its Board of Directors. Under this program, the Company may repurchase shares from time to time. The timing and actual number of shares repurchased will depend on a variety of factors, including price, general business and market conditions, and alternate uses of capital. The share repurchase program may be effected through open market purchases or privately negotiated transactions in compliance with Rule 10b-18 under the Securities Exchange Act of 1934, as amended, including through Rule 10b5-1 trading plans. The program may be suspended or discontinued at any time.
The Company has authorized a total of 25 million shares of $1 par value preferred stock. No shares of preferred stock were outstanding at December 31, 2017, 2016 or 2015.
NOTE 7 Global Health Care Medical Costs Payable |
Medical costs payable for the Global Health Care segment reflects estimates of the ultimate cost of claims that have been incurred but not reported, including expected development on reported claims, those that have been reported but not yet paid (reported claims in process), and other medical care expenses and services payable that are primarily comprised of accruals for incentives and other amounts payable to health care professionals and facilities.
Accounting policy. The Company uses actuarial principles and assumptions that are consistently applied each reporting period and recognizes the actuarial best estimate of the ultimate liability along with a margin for adverse deviation. This approach is consistent with actuarial standards of practice that the liabilities be adequate under moderately adverse conditions.
This liability predominately consists of incurred but not reported amounts and reported claims in process including expected development on reported claims. The liability is primarily calculated using "completion factors" developed by comparing the claim incurral date to the date claims were paid. Completion factors are impacted by several key items including changes in: 1) electronic (auto-adjudication) versus manual claim processing, 2) provider claims submission rates, 3) membership and 4) the mix of products. The Company uses historical completion factors combined with an analysis of current trends and operational factors to develop current estimates of completion factors. The Company estimates the liability for claims incurred in each month by applying the current estimates of completion factors to the current paid claims data. This approach implicitly assumes that historical completion rates will be a useful indicator for the current period.
For more recent months, the Company relies more heavily on medical cost trend analysis that reflects expected claim payment patterns and other relevant operational considerations. Medical cost trend is primarily impacted by medical service utilization and unit costs that are affected by changes in the level and mix of medical benefits offered, including inpatient, outpatient and pharmacy, the impact of copays and deductibles, changes in provider practices and changes in consumer demographics and consumption behavior.
For each reporting period, the Company compares key assumptions used to establish the medical costs payable to actual experience. When actual experience differs from these assumptions, medical costs payable are adjusted through current period shareholders' net income. Additionally, the Company evaluates expected future developments and emerging trends that may impact key assumptions. The process used to determine this liability requires the Company to make critical accounting estimates that involve considerable judgment, reflecting the
| | | CIGNA CORPORATION - 2017 Form 10-K 73 |
PART II
ITEM 8. Financial Statements and Supplementary Data
variability inherent in forecasting future claim payments. These estimates are highly sensitive to changes in the Company's key assumptions, specifically completion factors and medical cost trends.
Activity in medical costs payable for the years ended December 31 was as follows:
| (In millions) | 2017 | 2016 | 2015 |
||||||
| | | | | | | | | | |
| Balance at January 1, | $ | 2,532 | $ | 2,355 | $ | 2,180 | |||
| Less: Reinsurance and other amounts recoverable | 275 | 243 | 252 | ||||||
| | | | | | | | | | |
| Balance at January 1, net | | 2,257 | | 2,112 | | 1,928 | |||
| Incurred costs related to: | |||||||||
Current year |
| 20,233 | | 19,087 | | 18,564 | |||
Prior years |
(266) | (78) | (210) | ||||||
| | | | | | | | | | |
Total incurred |
| 19,967 | | 19,009 | | 18,354 | |||
| Paid costs related to: | |||||||||
Current year |
| 17,979 | | 17,052 | | 16,588 | |||
Prior years |
1,791 | 1,812 | 1,582 | ||||||
| | | | | | | | | | |
Total paid |
| 19,770 | | 18,864 | | 18,170 | |||
| Balance at December 31, net | 2,454 | 2,257 | 2,112 | ||||||
| Add: Reinsurance and other amounts recoverable | | 265 | | 275 | | 243 | |||
| | | | | | | | | | |
| Balance at December 31, | $ | 2,719 | $ | 2,532 | $ | 2,355 | |||
| | | | | | | | | | |
Reinsurance and other amounts recoverable reflect amounts due from reinsurers and policyholders to cover incurred but not reported and pending claims for certain business where the Company administers the plan benefits but the right of offset does not exist. See Note 9 for additional information on reinsurance.
The total of incurred but not reported liabilities plus expected development on reported claims, including reported claims in process, was $2.6 billion at December 31, 2017 and $2.4 billion at December 31, 2016. The remaining balance in both periods reflects amounts due for physician incentives and other medical care expenses and services payable.
For the years ended December 31, variances in incurred costs related to prior years' medical costs payable that resulted from the differences between actual experience and the Company's key assumptions were as follows:
| 2017 | 2016 |
|||||||||||
| | | | | | | | | | | | | |
| ($ in millions) | $ | % (1) | $ | % (2) |
||||||||
| | | | | | | | | | | | | |
| Actual completion factors | $ | 124 | | 0.7% | $ | 59 | | 0.3% | ||||
| Medical cost trend | 133 | 0.7 | 27 | 0.1 | ||||||||
| Other (3) | | 9 | | – | | (8) | | – | ||||
| | | | | | | | | | | | | |
| Total favorable variance | $ | 266 | 1.4% | $ | 78 | 0.4% | ||||||
| | | | | | | | | | | | | |
Incurred costs related to prior years in the table above, although adjusted through shareholders' net income, do not directly correspond to an increase or decrease to shareholders' net income. The primary reason for this difference is that decreases to prior year incurred costs pertaining to the portion of the liability established for moderately adverse conditions are not considered as impacting shareholders' net income if they are offset by increases in the current year provision for moderately adverse conditions.
The net impact of prior year development on shareholders' net income was a $112 million increase for the year ended December 31, 2017. The net impact of prior year development on shareholders' net income was insignificant in 2016. Favorable prior year development implies primarily lower than expected utilization of medical services and vice versa while amounts close to zero imply utilization of medical services that are consistent with expectations.
The following table depicts the incurred and paid claims development as of December 31, 2017 (net of reinsurance), claims frequency metrics and incurred but not reported liabilities for Cigna's Global Health Care medical costs payable. The information about incurred and paid claims development for the year ended December 31, 2016 is presented as supplementary information and is unaudited.
| 74 CIGNA CORPORATION - 2017 Form 10-K | | |
PART II
ITEM 8. Financial Statements and Supplementary Data
| Incurred Costs | ||||||||||||
| | | | | | | | | | | | | |
| ($ in millions, except for claims frequency) Incurral Year |
2016 (Unaudited) |
2017 | Medical Costs Payable |
Claims Frequency |
||||||||
| | | | | | | | | | | | | |
| 2016 | $ | 19,087 | $ | 18,822 | $ | 159 | | 2.7 million | ||||
| 2017 | 20,233 | $ | 2,254 | 3.3 million | ||||||||
| | | | | | | | | | | | | |
| Cumulative incurred costs for the periods presented | | | $ | 39,055 | | | | |||||
| | | | | | | | | | | | | |
| Cumulative Paid Costs | ||||||||||||
| | | | | | | | | | | | | |
| Incurral Year | 2016 (Unaudited) |
2017 | ||||||||||
| | | | | | | | | | | | | |
| 2016 | $ | 17,052 | $ | 18,663 | ||||||||
| 2017 | 17,979 | |||||||||||
| | | | | | | | | | | | | |
| Cumulative paid costs for the periods presented | | | $ | 36,642 | ||||||||
| | | | | | | | | | | | | |
| Outstanding liabilities for the periods presented, net of reinsurance | $ | 2,413 | ||||||||||
| Outstanding liabilities prior to 2016, net of reinsurance | | | | 41 | ||||||||
| | | | | | | | | | | | | |
| Net outstanding liabilities for Global Health Care medical costs payable | 2,454 | |||||||||||
| Reinsurance and other amounts recoverable | | | | 265 | ||||||||
| | | | | | | | | | | | | |
| Total liability for Global Health Care medical costs payable | $ | 2,719 | ||||||||||
| | | | | | | | | | | | | |
More than 95% of health claims for an accident year are paid within one year of their incurred date.
There is no single or common claim frequency metric used in the health care industry. The Company believes a relevant metric for the Global Health Care segment is the number of customers for whom an insured medical claim was paid. Customers for whom no insured medical claim was paid are excluded from the calculation. Claims that did not result in a liability are not included in the frequency metric.
NOTE 8 Liabilities for Unpaid Claims and Claim Expenses |
The following information relates to the Company's unpaid claims and claim expense liabilities.
Accounting policy. Liabilities for unpaid claims and claim expenses are established by book of business within the Company's Group Disability and Life, Global Supplemental Benefits and Other Operations segments. The Group Disability and Life segment's liability for unpaid claims and claim expenses consists of the following primary products: long-term and short-term disability, life insurance, and accident coverages. Unpaid claims and claim expenses consist of (1) case or claims reserves for reported claims that are unpaid as of the balance sheet date; (2) incurred but not reported reserves for claims when the insured event has occurred but has not been reported to the Company; and (3) loss adjustment expense reserves for the expected costs of settling these claims. The Company consistently estimates incurred but not yet reported losses using actuarial principles and assumptions based on historical and projected claim incidence patterns, claim size and the expected payment period. The Company recognizes the actuarial best estimate of the ultimate liability within a level of confidence, consistent with actuarial standards of practice that the liabilities be adequate under moderately adverse conditions. When estimates of these liabilities change, the Company immediately records the adjustment in benefits and expenses.
The majority of the Company's liability for disability claims consists of the present value of estimated future benefit payments, including expected development, for each reported claim that is currently receiving benefit payments, or pending a decision on eligibility for benefits, over the expected disability period. The Company projects the expected disability period by using historical resolution rates combined with an analysis of current trends and operational factors to develop current estimates of resolution rates. Using the Company's experience, expected claim resolution rates may vary based upon the anticipated disability period, the covered benefit period, the cause of disability, the benefit design and the claimant's age, gender and income level. The gross monthly benefit is reduced (offset) by disability income received under other benefit programs, most commonly Social Security Disability Income, workers' compensation, statutory disability or other group benefit plans. For certain offsets not yet finalized, the Company estimates the probability and amount of future offset awards and lapses based on the Company's experience.
The Company also establishes a liability for the expected present value of future benefit payments for known claims that have recently been resolved but may reopen in the future, based on Company experience. Prior to a claim becoming known, the Company establishes a liability for incurred but not reported claims, using standard actuarial techniques and calculations based on completion factors and loss ratio assumptions using the Company's experience combined with an analysis current trends and operational factors. Completion factors are impacted by several key items including changes in claim inventory levels, claim payment patterns, changes in business volume and other factors. Loss ratio assumptions are developed using historical Company experience, adjusted prospectively for expected changes in the underlying business including rate actions, persistency and inforce growth.
Liability balance details. The liability for unpaid claims and claim expenses by segment as of December 31 is as follows:
| (In millions) | 2017 | 2016 | ||||
| | | | | | | |
| Group Disability and Life | $ | 4,491 | $ | 4,342 | ||
| Global Supplemental Benefits | 484 | 384 | ||||
| Other Operations | | 193 | | 191 | ||
| | | | | | | |
| Unpaid claims and claim expenses | $ | 5,168 | $ | 4,917 | ||
| | | | | | | |
| | | CIGNA CORPORATION - 2017 Form 10-K 75 |
PART II
ITEM 8. Financial Statements and Supplementary Data
The Company discounts certain liabilities, predominantly long-term disability, because benefits payments are made over extended periods. Discount rate assumptions for these liabilities are based on projected investment returns for the supporting asset portfolios. Details of the Company's unpaid claim discounted liability balances as of December 31 were as follows:
| (In billions) | 2017 | 2016 | ||||
| | | | | | | |
| Discounted liabilities | $ | 4.0 | $ | 3.9 | ||
| Aggregate amount of discount | $ | 1.0 | $ | 1.1 | ||
| Range of discount rates | | 4.5% - 5.2% | | 3.3% - 5.8% | ||
| | | | | | | |
Interest is accreted and recognized in other benefit expenses in the Consolidated Statement of Income.
Activity in the Company's Group Disability and Life and the Global Supplemental Benefits segments' liabilities for unpaid claims and claim expenses are presented in the following table. Liabilities associated with the Company's Other Operations segment are excluded because they pertain to obligations for long-duration insurance contracts or, if short-duration, the liabilities have been fully reinsured.
| (In millions) | 2017 | 2016 | 2015 | ||||||
| | | | | | | | | | |
| Balance at January 1, | $ | 4,726 | $ | 4,359 | $ | 4,178 | |||
| Less: Reinsurance | 121 | 115 | 104 | ||||||
| | | | | | | | | | |
| Balance at January 1, net | | 4,605 | | 4,244 | | 4,074 | |||
| Incurred claims related to: | |||||||||
Current year |
| 4,341 | | 4,258 | | 3,813 | |||
Prior years |
|||||||||
Interest accretion |
| 163 | | 161 | | 163 | |||
All other incurred |
(4) | 93 | (91) | ||||||
| | | | | | | | | | |
Total incurred |
| 4,500 | | 4,512 | | 3,885 | |||
| Paid claims related to: | |||||||||
Current year |
| 2,724 | | 2,575 | | 2,325 | |||
Prior years |
1,572 | 1,560 | 1,382 | ||||||
| | | | | | | | | | |
Total paid |
| 4,296 | | 4,135 | | 3,707 | |||
| Acquisitions | – | – | 11 | ||||||
| Foreign currency | | 29 | | (16) | | (19) | |||
| | | | | | | | | | |
| Balance at December 31, net | 4,838 | 4,605 | 4,244 | ||||||
| Add: Reinsurance | | 137 | | 121 | | 115 | |||
| | | | | | | | | | |
| Balance at December 31, | $ | 4,975 | $ | 4,726 | $ | 4,359 | |||
| | | | | | | | | | |
Reinsurance in the previous table reflects amounts due from reinsurers related to unpaid claims liabilities. The Company's insurance subsidiaries enter into agreements with other companies primarily to limit losses from large exposures and to permit recovery of a portion of incurred losses. See Note 9 for additional information on reinsurance.
The majority of the liability for unpaid claims and claim expenses is related to disability claims with long-tailed payouts. Interest earned on assets backing these liabilities is an integral part of pricing and reserving. Therefore, interest accreted on prior year balances is shown as a separate component of prior year incurred claims. This interest is calculated by applying the average discount rate used in determining the liability balance to the average liability balance over the period. The remaining prior year incurred claims amount primarily reflects updates to the Company's liability estimates and variances between actual experience during the period relative to the assumptions and expectations reflected in determining the liability. Assumptions reflect the Company's expectations over the life of the book of business and will vary from actual experience in any period, both favorably and unfavorably, with variation in resolution rates being the most significant driver for the long-term disability business. Prior year incurred claims reported in 2016 included the impact of changes made to our disability claims management process and a period of elevated life claims.
Long-term disability development tables. The table below presents information about incurred and paid claims development as of December 31, 2017 (net of reinsurance) cumulative claim frequency and total incurred but not reported liabilities for the Company's long-term disability book of business. The information about incurred and paid claims development for the years ended 2012 through 2016 is presented as supplementary information and is unaudited. As permitted under GAAP, the Company presented development table information beginning in 2012 because obtaining information beyond this period was impracticable as historical data was not maintained in such detail.
| 76 CIGNA CORPORATION - 2017 Form 10-K | | |
PART II
ITEM 8. Financial Statements and Supplementary Data
(In millions, except for claims frequency) |
|||||||||||||||||||||||
| | | | | | | | | | | | | | | | | | | | | | | | |
|
Incurred Claims (undiscounted) | Incurred But Not |
|||||||||||||||||||||
| | | | | | | | | | | | | | | | | | | | | | | | |
Accident Year |
2012 (Unaudited) |
2013 (Unaudited) |
2014 (Unaudited) |
2015 (Unaudited) |
2016 (Unaudited) |
2017 | Reported Liabilities |
Claims Frequency |
|||||||||||||||
| | | | | | | | | | | | | | | | | | | | | | | | |
2012 |
$ | 995 | $ | 951 | $ | 889 | $ | 876 | $ | 883 | $ | 880 | $ | – | 21,180 | ||||||||
2013 |
1,063 | 1,037 | 1,062 | 1,072 | 1,057 | – | 23,516 | ||||||||||||||||
2014 |
| | | | | 1,158 | | 1,129 | | 1,167 | | 1,146 | | – | 25,281 | ||||||||
2015 |
1,184 | 1,154 | 1,185 | 5 | 25,609 | ||||||||||||||||||
2016 |
| | | | | | | | | 1,246 | | 1,184 | | 20 | 24,722 | ||||||||
2017 |
1,226 | 540 | 10,569 | ||||||||||||||||||||
| | | | | | | | | | | | | | | | | | | | | | | | |
Cumulative incurred claims for the periods presented |
$ | 6,678 | | | | ||||||||||||||||||
| | | | | | | | | | | | | | | | | | | | | | | | |
|
Cumulative Paid Claims | ||||||||||||||||||||||
| | | | | | | | | | | | | | | | | | | | | | | | |
Accident Year |
2012 (Unaudited) |
2013 (Unaudited) |
2014 (Unaudited) |
2015 (Unaudited) |
2016 (Unaudited) |
2017 | |||||||||||||||||
| | | | | | | | | | | | | | | | | | | | | | | | |
2012 |
$ | 81 | $ | 288 | $ | 429 | $ | 504 | $ | 571 | $ | 621 | |||||||||||
2013 |
92 | 342 | 503 | 600 | 670 | ||||||||||||||||||
2014 |
| | | | | 111 | | 379 | | 575 | | 667 | |||||||||||
2015 |
114 | 417 | 603 | ||||||||||||||||||||
2016 |
| | | | | | | | | 122 | | 411 | |||||||||||
2017 |
110 | ||||||||||||||||||||||
| | | | | | | | | | | | | | | | | | | | | | | | |
Cumulative paid claims for the periods presented |
| | $ | 3,082 | |||||||||||||||||||
| | | | | | | | | | | | | | | | | | | | | | | | |
All outstanding liabilities for the periods presented, net of reinsurance |
$ | 3,596 | |||||||||||||||||||||
All outstanding liabilities prior to 2012, net of reinsurance |
| | | 1,142 | |||||||||||||||||||
Impact of discounting |
(948 | ) | |||||||||||||||||||||
| | | | | | | | | | | | | | | | | | | | | | | | |
Liability for long-term disability unpaid claims and claim expenses, net of reinsurance |
| | $ | 3,790 | |||||||||||||||||||
| | | | | | | | | | | | | | | | | | | | | | | | |
The claims frequency metric used for the Company's long-term disability line of business represents the number of unique claim events for which benefits have been approved and payments made. Claim events are identified using a unique claimant identifier and incurral date. Thus, if an individual has multiple claims for different disabling events (and therefore different incurral dates), each will be determined to be a unique claim event. However, if an individual receives multiple benefits under more than one policy (for example for supplemental disability benefits such as pension contribution benefits or survivor benefits), the Company treats this as a single claim occurrence because they related to the same claim event. Claims frequency metrics for the most recent year are expected to be low reflecting the long-term disability product features including waiting and elimination periods that result in delayed eligibility for contract benefits. Claims that did not result in a liability are not included in the frequency metric.
The following is supplementary and unaudited information about average historical claims payout patterns for the long-term disability business for the years presented in the development table as of December 31, 2017. The average annual percentage payout of incurred claims, net of reinsurance, is approximately 9% in year one, 24% in year two, 16% in year three, 9% in year four, 7% in year five, and 6% in year six.
The following table reconciles the long-term disability net incurred and paid claims development table to the liability for unpaid claims and claim expenses in the Company's Consolidated Balance Sheets as of December 31, 2017.
| (In millions) |
|
|||
|---|---|---|---|---|
| | | | | |
Net outstanding liabilities – Group Disability and Life segment |
| |||
Long-term disability liabilities, net of reinsurance |
$ | 3,790 | ||
Other short-duration insurance books of business, net of reinsurance |
| 599 | ||
| | | | | |
Liabilities for unpaid claims and claim expenses, net of reinsurance |
4,389 | |||
| | | | | |
Reinsurance recoverable on unpaid claims – Group Disability and Life segment |
| |||
Long-term disability |
94 | |||
Other short-duration insurance books of business |
| 8 | ||
| | | | | |
Total reinsurance recoverable on unpaid claims |
102 | |||
| | | | | |
Total liability for unpaid claims and claim expenses – Group Disability and Life segment |
| 4,491 | ||
| | | | | |
Global Supplemental Benefits segment |
484 | |||
Other Operations segment |
| 193 | ||
| | | | | |
Total liability for unpaid claims and claim expenses |
$ | 5,168 | ||
| | | | | |
The other short-duration insurance books of business, net of reinsurance, primarily include liabilities for life, accident and short-term disability insurance products. Liabilities for these products are typically complete within one year. Claim development on these liabilities is largely driven by completion factors and loss ratio assumptions. In 2016, development on these liabilities was driven by a period of elevated life claims.
| | | CIGNA CORPORATION - 2017 Form 10-K 77 |
PART II
ITEM 8. Financial Statements and Supplementary Data
NOTE 9 Reinsurance |
The Company's insurance subsidiaries enter into agreements with other insurance companies to assume and cede reinsurance. Reinsurance is ceded primarily to limit losses from large exposures and to permit recovery of a portion of direct or assumed losses. Reinsurance is also used in acquisition and disposition transactions when the underwriting company is not being acquired. Reinsurance does not relieve the originating insurer of liability. Therefore, reinsured liabilities must continue to be reported along with the related reinsurance recoverables. The Company regularly evaluates the financial condition of its reinsurers and monitors concentrations of its credit risk.
Reinsurance Recoverables
The majority of the Company's reinsurance recoverables resulted from acquisition and disposition transactions in which the underwriting company was not acquired. Components of the Company's reinsurance recoverables are presented in the following table:
| (Dollars in millions) Line of Business |
Reinsurer(s) |
December 31, 2017 |
December 31, 2016 |
Collateral and Other Terms at December 31, 2017 |
||||||
|---|---|---|---|---|---|---|---|---|---|---|
| | | | | | | | | | | |
| Ongoing Operations | | | ||||||||
| Global Health Care, Global Supplemental Benefits, Group Disability and Life, COLI | Various | $ | 454 | $ | 478 | Recoverables from approximately 90 reinsurers, used in the ordinary course of business. Current balances range from less than $1 million up to $80 million. Over 70% of the balance is from companies rated as investment grade by Standard & Poor's, and 11% is secured by assets in trusts or letters of credit. | ||||
| Total recoverables related to ongoing operations | | | 454 | | 478 | | ||||
| Acquisition, disposition or runoff activities | ||||||||||
| Individual Life and Annuity (sold in 1998) | Lincoln National Life and Lincoln Life & Annuity of New York | | 3,436 | | 3,586 | Both companies' ratings were sufficient to avoid triggering a contractual obligation to fully secure the outstanding balance. | ||||
| GMDB (effectively exited in 2013) | Berkshire | 928 | 1,085 | 100% secured by assets in a trust. | ||||||
| Other | 34 | 44 | 100% secured by assets in a trust or letters of credit. | |||||||
| Retirement Benefits Business (sold in 2004) | Prudential Retirement Insurance and Annuity | | 850 | | 921 | 100% secured by assets in a trust. | ||||
| Supplemental Benefits Business (2012 acquisition) | Great American Life | 283 | 297 | 100% secured by assets in a trust. | ||||||
| Other run-off reinsurance | Various | | 61 | | 67 | 100% secured by assets in a trust or other deposits. | ||||
| | | | | | | | | | | |
| Total recoverables related to acquisition, disposition or runoff activities | 5,592 | 6,000 | ||||||||
| | | | | | | | | | | |
|
Total reinsurance recoverables |
| $ | 6,046 | $ | 6,478 | | ||||
| | | | | | | | | | | |
The Company bears the risk of loss if its reinsurers and retrocessionaires do not meet or are unable to meet their reinsurance obligations to the Company. The Company reviews its reinsurance arrangements and establishes reserves against the recoverables if recovery is not considered probable.
Effects of Reinsurance
The following table presents direct, assumed and ceded premiums for both short-duration and long-duration insurance contracts. It also presents reinsurance recoveries that have been netted against benefits and expenses in the Company's Consolidated Statements of Income.
| (In millions) |
2017 |
2016 |
2015 |
|||||||
|---|---|---|---|---|---|---|---|---|---|---|
| | | | | | | | | | | |
Premiums |
| | | |||||||
Short-duration contracts |
||||||||||
Direct |
$ | 28,654 | $ | 27,496 | $ | 26,751 | ||||
Assumed |
199 | 247 | 289 | |||||||
Ceded |
| (150 | ) | | (229 | ) | | (254 | ) | |
| | | | | | | | | | | |
Total short-duration contract premiums |
28,703 | 27,514 | 26,786 | |||||||
| | | | | | | | | | | |
Long-duration contracts |
| | | |||||||
Direct |
3,748 | 3,259 | 3,061 | |||||||
Assumed |
| 130 | | 137 | | 111 | ||||
Ceded |
||||||||||
Individual life insurance and annuity business sold |
| (143 | ) | | (153 | ) | | (158 | ) | |
Other |
(131 | ) | (131 | ) | (158 | ) | ||||
| | | | | | | | | | | |
Total long-duration contract premiums |
| 3,604 | | 3,112 | | 2,856 | ||||
| | | | | | | | | | | |
Total premiums |
$ | 32,307 | $ | 30,626 | $ | 29,642 | ||||
| | | | | | | | | | | |
Reinsurance recoveries |
| | | |||||||
Individual life insurance and annuity business sold |
$ | 259 | $ | 279 | $ | 301 | ||||
Other |
| 66 | | 261 | | 436 | ||||
| | | | | | | | | | | |
Total reinsurance recoveries |
$ | 325 | $ | 540 | $ | 737 | ||||
| | | | | | | | | | | |
The effects of reinsurance on written premiums for short-duration contracts were not materially different from the recognized premium amounts shown in the table above.
| 78 CIGNA CORPORATION - 2017 Form 10-K | | |
PART II
ITEM 8. Financial Statements and Supplementary Data
Effective Exit of GMDB and GMIB Business
In 2013, the Company entered into an agreement with Berkshire to effectively exit the GMDB and GMIB business via a reinsurance transaction. Berkshire reinsured 100% of the Company's future claim payments in this business, net of other reinsurance arrangements existing at that time. The reinsurance agreement is subject to an overall limit with approximately $3.4 billion remaining at December 31, 2017.
GMDB is accounted for as reinsurance and GMIB assets and liabilities are reported as derivatives at fair value as discussed below. GMIB assets are reported in other assets, including intangibles, and GMIB liabilities are reported in accounts payable, accrued expenses and other liabilities.
GMDB
The majority of the GMDB exposure arises under annuities written by ceding companies that guarantee the benefit received at death will be no less than the highest historical account value of the related mutual fund investments on a contractholder's anniversary date. Under this type of death benefit, the Company's exposure arises when the highest anniversary account value exceeds the fair value of the related mutual fund investments at the time of a contractholder's death.
Accounting policy. The Company estimates the gross liability and reinsurance recoverable with an internal model based on the Company's experience and future expectations over an extended period, consistent with the long-term nature of this product. As a result of the reinsurance transaction, reserve increases have a corresponding increase in the recorded reinsurance recoverable, provided the increased recoverable remains within the overall Berkshire limit (including the GMIB asset presented below). The ending net retained reserve covers ongoing administrative expenses, as well as minor claim exposure retained by the Company.
Because the product is premium deficient, the Company records an increase to the net retained reserve if it is inadequate based on the model.
The following table presents the account value, net amount at risk and average attained age of underlying contractholders for guarantees assumed by the Company in the event of death. The net amount at risk is the amount that the Company would have to pay if all contractholders died as of the specified date. Unless the Berkshire reinsurance limit is exceeded, the Company should be reimbursed in full for these payments.
| (Dollars in millions, excludes impact of reinsurance ceded) | 2017 | 2016 | ||||
| | | | | | | |
| Account value | $ | 10,109 | $ | 10,650 | ||
| Net amount at risk | $ | 2,112 | $ | 2,458 | ||
| Average attained age of contractholders (weighted by exposure) | | 75 | | 75 | ||
| Number of contractholders | 245,000 | 285,000 | ||||
| | | | | | | |
GMIB
In this business, the Company reinsured contracts with issuers of GMIB products. The Company's exposure represents the excess of a contractually guaranteed amount over the level of variable annuity account values. Payment by the Company depends on the actual account value in the underlying mutual funds and the level of interest rates when the contractholders elect to receive minimum income payments that must occur within 30 days of a policy anniversary after the appropriate waiting period. The Company has purchased retrocessional coverage ("GMIB assets") for these contracts.
Accounting policy. The Company reports GMIB liabilities and assets as derivatives at fair value because cash flows of these liabilities and assets are affected by equity markets and interest rates, but are without significant life insurance risk and are settled in lump sum payments. Periodically, the Company receives and pays fees based on either contractholders' account values or deposits increased at a contractual rate. The Company will also pay and receive cash depending on changes in account values and interest rates when contractholders first elect to receive minimum income payments. Cash flows on these contracts are reported in operating activities.
As of December 31, 2017 and 2016, there were three reinsurers for GMIB as follows:
| (In millions) Line of Business |
Reinsurer |
December 31, 2017 |
December 31, 2016 |
Collateral and Other Terms at December 31, 2017 |
||||||
|---|---|---|---|---|---|---|---|---|---|---|
| | | | | | | | | | | |
| GMIB | Berkshire | $ | 359 | $ | 370 | 100% were secured by assets in a trust. | ||||
| Sun Life Assurance Company of Canada | 221 | 227 | ||||||||
| | Liberty Re (Bermuda) Ltd. | | 197 | | 202 | 100% were secured by assets in a trust. | ||||
| | | | | | | | | | | |
| Total GMIB recoverables reported in other assets | $ | 777 | $ | 799 | ||||||
| | | | | | | | | | | |
Assumptions used in fair value measurement. GMIB assets and liabilities are established using capital market assumptions (including market returns, interest rates and market volatilities of the underlying equity and bond mutual fund investments) and assumptions related to future annuitant behavior (including mortality, lapse, and annuity election rates). As assumptions related to future annuitant behavior are largely unobservable, the Company classifies GMIB assets and liabilities in Level 3 in the fair value hierarchy presented in Note 10.
The only assumption expected to impact future shareholders' net income is non-performance risk. The non-performance risk adjustment reflects a market participant's view of nonpayment risk by adding an additional spread to the discount rate in the calculation of both (a) the GMIB liabilities to be paid by the Company, and (b) the GMIB assets to be paid by the reinsurers, after considering collateral.
The Company regularly evaluates each of the assumptions used in establishing these assets and liabilities. Significant decreases in assumed lapse rates or spreads used to calculate non-performance risk of the Company, or significant increases in assumed annuity election rates or spreads used to calculate the non-performance risk of the reinsurers, would result in higher fair value measurements. A change in one of these assumptions is not necessarily accompanied by a change in another assumption.
| | | CIGNA CORPORATION - 2017 Form 10-K 79 |
PART II
ITEM 8. Financial Statements and Supplementary Data
GMIB guarantees. Future payments are not fixed and determinable under the terms of these contracts. Accordingly, the Company calculated exposure, without considering any reinsurance coverage, using the following hypothetical assumptions:
The Company has reinsurance coverage in place that covers the exposures on these contracts. Using these hypothetical assumptions, GMIB exposure is $573 million, which is lower than the recorded liability for GMIB calculated using fair value assumptions.
NOTE 10 Fair Value Measurements |
The Company carries certain financial instruments at fair value in the financial statements including fixed maturities, equity securities, short-term investments and derivatives. Other financial instruments are measured at fair value only under certain conditions, such as when impaired.
Fair value is defined as the price at which an asset could be exchanged in an orderly transaction between market participants at the balance sheet date. A liability's fair value is defined as the amount that would be paid to transfer the liability to a market participant, not the amount that would be paid to settle the liability with the creditor.
The Company's financial assets and liabilities carried at fair value have been classified based upon a hierarchy defined by GAAP. The hierarchy gives the highest ranking to fair values determined using unadjusted quoted prices in active markets for identical assets and liabilities (Level 1) and the lowest ranking to fair values determined using methodologies and models with unobservable inputs (Level 3). An asset's or a liability's classification is based on the lowest level of input that is significant to its measurement. For example, a financial asset or liability carried at fair value would be classified in Level 3 if unobservable inputs were significant to the instrument's fair value, even though the measurement may be derived using inputs that are both observable (Levels 1 and 2) and unobservable (Level 3).
The Company estimates fair values using prices from third parties or internal pricing methods. Fair value estimates received from third-party pricing services are based on reported trade activity and quoted market prices when available, and other market information that a market participant may use to estimate fair value. The internal pricing methods are performed by the Company's investment professionals and generally involve using discounted cash flow analyses, incorporating current market inputs for similar financial instruments with comparable terms and credit quality, as well as other qualitative factors. In instances where there is little or no market activity for the same or similar instruments, fair value is estimated using methods, models and assumptions that the Company believes a hypothetical market participant would use to determine a current transaction price. These valuation techniques involve some level of estimation and judgment that becomes significant with increasingly complex instruments or pricing models.
The Company is responsible for determining fair value, as well as for assigning the appropriate level within the fair value hierarchy, based on the significance of unobservable inputs. The Company reviews methodologies, processes and controls of third-party pricing services and compares prices on a test basis to those obtained from other external pricing sources or internal estimates. The Company performs ongoing analyses of both prices received from third-party pricing services and those developed internally to determine that they represent appropriate estimates of fair value. The controls executed by the Company include evaluating changes in prices and monitoring for potentially stale valuations. The Company also performs sample testing of sales values to confirm the accuracy of prior fair value estimates. The minimal exceptions identified during these processes indicate that adjustments to prices are infrequent and do not significantly impact valuations. Annually, we conduct an on-site visit of the most significant pricing service to review their processes, methodologies and controls. This on-site review includes a walk-through of inputs for a sample of securities held across various asset types to validate the documented pricing process.
A. Financial Assets and Financial Liabilities Carried at Fair Value
The following table provides information as of December 31, 2017 and 2016 about the Company's financial assets and liabilities carried at fair value. Separate account assets that are also recorded at fair value on the Company's Consolidated Balance Sheets are reported separately in the Separate Accounts section as gains and losses related to these assets generally accrue directly to policyholders.
| 80 CIGNA CORPORATION - 2017 Form 10-K | | |
PART II
ITEM 8. Financial Statements and Supplementary Data
As of December 31,
| Quoted Prices in Active Markets for Identical Assets (Level 1) |
Significant Other Observable Inputs (Level 2) |
Significant Unobservable Inputs (Level 3) |
Total |
|||||||||||||||||||||
| | | | | | | | | | | | | | | | | | | | | | | | | |
| (In millions) | 2017 | 2016 | 2017 | 2016 | 2017 | 2016 | 2017 | 2016 |
||||||||||||||||
| | | | | | | | | | | | | | | | | | | | | | | | | |
| Financial assets at fair value | | | | | | | | | ||||||||||||||||
| Fixed maturities | ||||||||||||||||||||||||
Federal government and agency |
$ | 253 | $ | 374 | $ | 526 | $ | 503 | $ | – | $ | – | $ | 779 | $ | 877 | ||||||||
State and local government |
– | – | 1,287 | 1,435 | – | – | 1,287 | 1,435 | ||||||||||||||||
Foreign government |
| – | | – | | 2,442 | | 2,066 | | 45 | | 47 | | 2,487 | | 2,113 | ||||||||
Corporate |
– | – | 17,658 | 15,552 | 430 | 498 | 18,088 | 16,050 | ||||||||||||||||
Mortgage and other asset-backed |
| – | | – | | 343 | | 329 | | 154 | | 157 | | 497 | | 486 | ||||||||
| | | | | | | | | | | | | | | | | | | | | | | | | |
| Total fixed maturities | | 253 | | 374 | | 22,256 | | 19,885 | | 629 | | 702 | | 23,138 | | 20,961 | ||||||||
| Equity securities | 412 | 396 | 73 | 113 | 103 | 74 | 588 | 583 | ||||||||||||||||
| | | | | | | | | | | | | | | | | | | | | | | | | |
Subtotal |
| 665 | | 770 | | 22,329 | | 19,998 | | 732 | | 776 | | 23,726 | | 21,544 | ||||||||
| Short-term investments | – | – | 199 | 691 | – | – | 199 | 691 | ||||||||||||||||
| GMIB assets | | – | | – | | – | | – | | 777 | | 799 | | 777 | | 799 | ||||||||
| Other derivative assets | – | – | 2 | 10 | – | – | 2 | 10 | ||||||||||||||||
| | | | | | | | | | | | | | | | | | | | | | | | | |
| Total financial assets at fair value, excluding separate accounts | $ | 665 | $ | 770 | $ | 22,530 | $ | 20,699 | $ | 1,509 | $ | 1,575 | $ | 24,704 | $ | 23,044 | ||||||||
| | | | | | | | | | | | | | | | | | | | | | | | | |
| Financial liabilities at fair value | ||||||||||||||||||||||||
| GMIB liabilities | $ | – | $ | – | $ | – | $ | – | $ | 762 | $ | 780 | $ | 762 | $ | 780 | ||||||||
| Other derivative liabilities | – | – | 25 | 5 | – | – | 25 | 5 | ||||||||||||||||
| | | | | | | | | | | | | | | | | | | | | | | | | |
| Total financial liabilities at fair value, excluding separate accounts | $ | – | $ | – | $ | 25 | $ | 5 | $ | 762 | $ | 780 | $ | 787 | $ | 785 | ||||||||
| | | | | | | | | | | | | | | | | | | | | | | | | |
Level 1 Financial Assets
Inputs for instruments classified in Level 1 include unadjusted quoted prices for identical assets in active markets accessible at the measurement date. Active markets provide pricing data for trades occurring at least weekly and include exchanges and dealer markets.
Assets in Level 1 include actively-traded U.S. government bonds and exchange-listed equity securities. Given the narrow definition of Level 1 and the Company's investment asset strategy to maximize investment returns, a relatively small portion of the Company's investment assets are classified in this category.
Level 2 Financial Assets and Financial Liabilities
Inputs for instruments classified in Level 2 include quoted prices for similar assets or liabilities in active markets, quoted prices from those willing to trade in markets that are not active, or other inputs that are market observable or can be corroborated by market data for the term of the instrument. Such other inputs include market interest rates and volatilities, spreads and yield curves. An instrument is classified in Level 2 if the Company determines that unobservable inputs are insignificant.
Fixed maturities and equity securities. Approximately 94% of the Company's investments in fixed maturities and equity securities are classified in Level 2 including most public and private corporate debt and equity securities, federal agency and municipal bonds, non-government mortgage-backed securities and preferred stocks. Because many fixed maturities do not trade daily, third-party pricing services and internal methods often use recent trades of securities with similar features and characteristics. When recent trades are not available, pricing models are used to determine these prices. These models calculate fair values by discounting future cash flows at estimated market interest rates. Such market rates are derived by calculating the appropriate spreads over comparable U.S. Treasury securities, based on the credit quality, industry and structure of the asset. Typical inputs and assumptions to pricing models include, but are not limited to, a combination of benchmark yields, reported trades, issuer spreads, liquidity, benchmark securities, bids, offers, reference data, and industry and economic events. For mortgage-backed securities, inputs and assumptions may also include characteristics of the issuer, collateral attributes, prepayment speeds and credit rating.
Nearly all of these instruments are valued using recent trades or pricing models. Less than 1% of the fair value of investments classified in Level 2 represents foreign bonds that are valued using a single unadjusted market-observable input derived by averaging multiple broker-dealer quotes, consistent with local market practice.
Short-term investments are carried at fair value which approximates cost. On a regular basis, the Company compares market prices for these securities to recorded amounts to validate that current carrying amounts approximate exit prices. The short-term nature of the investments and corroboration of the reported amounts over the holding period support their classification in Level 2.
Other derivatives classified in Level 2 represent over-the-counter instruments such as interest rate and foreign currency swap contracts. Fair values for these instruments are determined using market observable inputs including forward currency and interest rate curves and widely published market observable indices. Credit risk related to the counterparty and the Company is considered when estimating the fair values of these derivatives. However, the Company is largely protected by collateral arrangements with counterparties and determined that no adjustment for credit risk was required as of December 31, 2017 or 2016. Level 2 also includes exchange-traded interest rate swap contracts.
| | | CIGNA CORPORATION - 2017 Form 10-K 81 |
PART II
ITEM 8. Financial Statements and Supplementary Data
Credit risk related to the clearinghouse counterparty and the Company is considered minimal when estimating the fair values of these derivatives because of upfront margin deposits and daily settlement requirements. The nature and use of these other derivatives are described in Note 12.
Level 3 Financial Assets and Financial Liabilities
Certain inputs for instruments classified in Level 3 are unobservable (supported by little or no market activity) and significant to their resulting fair value measurement. Unobservable inputs reflect the Company's best estimate of what hypothetical market participants would use to determine a transaction price for the asset or liability at the reporting date.
The Company classifies certain newly issued, privately-placed, complex or illiquid securities, as well as assets and liabilities relating to GMIB, in Level 3. Approximately 3% of fixed maturities and equity securities are priced using significant unobservable inputs and classified in this category.
Fair values of mortgage and other asset-backed securities, corporate and government fixed maturities are primarily determined using pricing models that incorporate the specific characteristics of each asset and related assumptions including the investment type and structure, credit quality, industry and maturity date in comparison to current market indices, spreads and liquidity of assets with similar characteristics. For mortgage and other asset-backed securities, inputs and assumptions for pricing may also include collateral attributes and prepayment speeds. Recent trades in the subject security or similar securities are assessed when available, and the Company may also review published research in its evaluation, as well as the issuer's financial statements.
Quantitative Information about Unobservable Inputs
The following table summarizes the fair value and significant unobservable inputs used in pricing the following securities that were developed directly by the Company as of December 31, 2017 and 2016. The range and weighted average basis point amounts ("bps") for fixed maturity spreads (adjustment to discount rates) and price-to-earnings multiples for equity investments reflect the Company's best estimates of the unobservable adjustments a market participant would make to calculate these fair values.
Mortgage and other asset-backed securities. The significant unobservable inputs used to value the following mortgage and other asset-backed securities are liquidity and
weighting of credit spreads. When
there is limited trading activity for the security, an adjustment for liquidity is made as of the measurement date that considers current market conditions, issuer circumstances and complexity of the
security structure. An adjustment to weight credit spreads is needed to value a more complex bond structure with multiple underlying collateral and no standard market valuation technique. The
weighting of credit spreads is primarily based on the underlying collateral's characteristics and their proportional cash flows supporting the bond obligations.
Corporate and government fixed maturities. The significant unobservable input used to value the following corporate and government fixed maturities is an adjustment for
liquidity. When there is limited
trading activity for the security, an adjustment is needed to reflect current market conditions and issuer circumstances.
Private equity securities. The significant unobservable input used to value the following private equity securities is a multiple of earnings before interest, taxes,
depreciation and
amortization ("EBITDA"). These securities are comprised of private equity investments with limited trading activity and therefore a ratio of EBITDA is used to estimate value based on company
circumstances and relative risk characteristics.
Hybrid equity securities. The significant unobservable input used to value the following hybrid equity securities is an adjustment for liquidity due to limited trading activity.
These
cumulative preferred shares are deemed likely to exercise certain call options and the Company estimates an adjustment used to discount cash flows based on current market conditions and issuer
circumstances.
As of December 31,
|
Fair Value | Unobservable Adjustment Range (Weighted Average) |
||||||||||
| | | | | | | | | | | | | |
(Fair value in millions) |
2017 | 2016 | Unobservable Input | 2017 | 2016 |
|||||||
| | | | | | | | | | | | | |
Fixed maturities |
| | ||||||||||
Mortgage and other asset-backed securities |
$ | 154 | $ | 157 | Liquidity | 60 – 370 (90) bps | 60 – 330 (90) bps | |||||
|
| | | | Weighting of credit spreads | 180 – 290 (230) bps | 160 – 470 (230) bps | |||||
Corporate and government fixed maturities |
446 | 490 | Liquidity | 70 – 1,650 (300) bps | 80 – 1,300 (340) bps | |||||||
| | | | | | | | | | | | | |
Total fixed maturities |
| 600 | | 647 | | | | |||||
Equity securities |
||||||||||||
Private equity securities |
| 70 | | 74 | Price-to-EBITDA multiples | 5.0 – 12.0 (8.9) | 4.2 – 11.6 (8.5) | |||||
Hybrid equity securities |
33 | – | Liquidity | 270 – 270 (270) bps | ||||||||
| | | | | | | | | | | | | |
Total equity securities |
| 103 | | 74 | | | | |||||
Subtotal |
703 | 721 | ||||||||||
Securities not priced by the Company (1) |
| 29 | | 55 | | | | |||||
| | | | | | | | | | | | | |
Total Level 3 securities |
$ | 732 | $ | 776 | ||||||||
| | | | | | | | | | | | | |
Significant increases in liquidity or credit spreads would result in lower fair value measurements while decreases in these inputs would result in higher fair value measurements. Significant decreases in equity price-to-EBITDA multiples would result in lower fair value measurements while increases in these inputs would result in higher fair value measurements. Generally, the unobservable inputs are not interrelated and a change in the assumption used for one unobservable input is not accompanied by a change in the other unobservable input.
| 82 CIGNA CORPORATION - 2017 Form 10-K | | |
PART II
ITEM 8. Financial Statements and Supplementary Data
GMIB contracts. See discussion in Note 9.
Changes in Level 3 Financial Assets and Financial Liabilities Carried at Fair Value
The following table summarizes the changes in financial assets and financial liabilities classified in Level 3 for the years ended December 31, 2017 and 2016. Separate account asset changes are reported in the Separate Accounts section as the changes in fair values of these assets generally accrue directly to the policyholders. Gains and losses reported in this table may include net changes in fair value that are attributable to both observable and unobservable inputs.
| |
Fixed Maturities & Equity Securities |
GMIB Assets |
GMIB Liabilities |
|||||||||||||||
|---|---|---|---|---|---|---|---|---|---|---|---|---|---|---|---|---|---|---|
| | | | | | | | | | | | | | | | | | | |
(In millions) |
2017 | 2016 | 2017 | 2016 | 2017 | 2016 | ||||||||||||
| | | | | | | | | | | | | | | | | | | |
Balance at January 1, |
$ | 776 | $ | 726 | $ | 799 | $ | 907 | $ | (780) | $ | (885) | ||||||
| | | | | | | | | | | | | | | | | | | |
Gains (losses) included in shareholders' net income |
||||||||||||||||||
GMIB fair value gain/(loss) |
| – | | – | | 31 | | (47) | | (31) | | 47 | ||||||
Other |
25 | (18) | 1 | – | (5) | (3) | ||||||||||||
| | | | | | | | | | | | | | | | | | | |
Total gains (losses) included in shareholders' net income |
| 25 | | (18) | | 32 | | (47) | | (36) | | 44 | ||||||
| | | | | | | | | | | | | | | | | | | |
Losses included in other comprehensive income |
(11) | (1) | – | – | – | – | ||||||||||||
Gains required to adjust future policy benefits for settlement annuities (1) |
| 7 | | 29 | | – | | – | | – | | – | ||||||
Purchases, sales, settlements |
||||||||||||||||||
Purchases |
| 133 | | 96 | | – | | – | | – | | – | ||||||
Sales |
(95) | (140) | – | – | – | – | ||||||||||||
Settlements |
| (74) | | (74) | | (54) | | (61) | | 54 | | 61 | ||||||
| | | | | | | | | | | | | | | | | | | |
Total purchases, sales and settlements |
(36) | (118) | (54) | (61) | 54 | 61 | ||||||||||||
| | | | | | | | | | | | | | | | | | | |
Transfers into/(out of) Level 3 |
| | | | | | ||||||||||||
Transfers into Level 3 |
275 | 338 | – | – | – | – | ||||||||||||
Transfers out of Level 3 |
| (304) | | (180) | | – | | – | | – | | – | ||||||
| | | | | | | | | | | | | | | | | | | |
Total transfers into/(out of) Level 3 |
(29) | 158 | – | – | – | – | ||||||||||||
| | | | | | | | | | | | | | | | | | | |
Balance at December 31, |
$ | 732 | $ | 776 | $ | 777 | $ | 799 | $ | (762) | $ | (780) | ||||||
| | | | | | | | | | | | | | | | | | | |
Total gains (losses) included in shareholders' net income attributable to instruments held at the reporting date |
$ | (9) | $ | (18) | $ | 32 | $ | (47) | $ | (36) | $ | 44 | ||||||
| | | | | | | | | | | | | | | | | | | |
As noted in the preceding tables, total gains and losses included in shareholders' net income are reflected in the following captions in the Consolidated Statements of Income:
In the tables above, gains and losses included in other comprehensive income are reflected in net unrealized appreciation (depreciation) on securities in the Consolidated Statements of Comprehensive Income.
Reclassifications impacting Level 3 financial instruments are reported as transfers into or out of the Level 3 category as of the beginning of the quarter in which the transfer occurs. Therefore gains and losses in income only reflect activity for the period the instrument was classified in Level 3.
Transfers into or out of the Level 3 category occur when unobservable inputs, such as the Company's best estimate of what a market participant would use to determine a current transaction price, become more or less significant to the fair value measurement. During 2017 and 2016, transfers between Level 2 and Level 3 primarily reflected changes in liquidity and credit risk estimates for certain private placement issuers across several sectors including metals, mining, energy, utilities, capital goods, consumer products and transportation services.
Separate Accounts
Accounting policy. Separate account assets and liabilities are contractholder funds maintained in accounts with specific investment objectives. The assets of these accounts are legally segregated and are not subject to claims that arise out of any of the Company's other businesses. These separate account assets are carried at fair value with equal amounts recorded for related separate account liabilities. The investment income and fair value gains and losses of these accounts generally accrue directly to the contractholders and, together with their deposits and withdrawals, are excluded from the Company's Consolidated Statements of Income and Cash Flows. Fees and charges earned for mortality risks, asset management or administrative services are reported in either premiums or fees and other revenues. Investments that are measured using the practical expedient of Net Asset Value ("NAV") are excluded from the fair value hierarchy.
| | | CIGNA CORPORATION - 2017 Form 10-K 83 |
PART II
ITEM 8. Financial Statements and Supplementary Data
At December 31, fair values of separate account assets were as follows:
| |
Quoted Prices in Active Markets for Identical Assets (Level 1) |
Significant Other Observable Inputs (Level 2) |
Significant Unobservable Inputs (Level 3) |
Total |
||||||||||||||||||||
|---|---|---|---|---|---|---|---|---|---|---|---|---|---|---|---|---|---|---|---|---|---|---|---|---|
| | | | | | | | | | | | | | | | | | | | | | | | | |
(In millions) |
2017 | 2016 | 2017 | 2016 | 2017 | 2016 | 2017 | 2016 | ||||||||||||||||
| | | | | | | | | | | | | | | | | | | | | | | | | |
Guaranteed separate accounts (See Note 21) |
$ | 215 | $ | 238 | $ | 308 | $ | 262 | $ | – | $ | – | $ | 523 | $ | 500 | ||||||||
Non-guaranteed separate accounts (1) |
1,536 | 1,368 | 5,298 | 4,885 | 292 | 331 | 7,126 | 6,584 | ||||||||||||||||
| | | | | | | | | | | | | | | | | | | | | | | | | |
Subtotal |
$ | 1,751 | $ | 1,606 | $ | 5,606 | $ | 5,147 | $ | 292 | $ | 331 | | 7,649 | | 7,084 | ||||||||
| | | | | | | | | | | | | | | | | | | | | | | | | |
Non-guaranteed separate accounts priced at NAV as a practical expedient (1) |
774 | 856 | ||||||||||||||||||||||
| | | | | | | | | | | | | | | | | | | | | | | | | |
Total separate account assets |
| | | | | | | | | | | | $ | 8,423 | $ | 7,940 | ||||||||
| | | | | | | | | | | | | | | | | | | | | | | | | |
Separate account assets in Level 1 primarily include exchange-listed equity securities. Level 2 assets primarily include:
Separate account assets classified in Level 3 primarily support Cigna's pension plans, and include certain newly issued, privately-placed, complex, or illiquid securities that are priced using methods discussed above, as well as commercial mortgage loans that are valued according to the methodologies discussed below. The following tables summarize the changes in separate account assets reported in Level 3 for the years ended December 31, 2017 and 2016.
| (In millions) |
2017 |
2016 |
||||
|---|---|---|---|---|---|---|
| | | | | | | |
Balance at January 1 |
$ | 331 | $ | 297 | ||
Policyholder gains (losses) |
34 | 2 | ||||
Purchases, issuances, settlements |
| | ||||
Purchases |
33 | 22 | ||||
Sales |
| (53) | | (11) | ||
Settlements |
(13) | (18) | ||||
| | | | | | | |
Total purchases, sales and settlements |
| (33) | | (7) | ||
| | | | | | | |
Transfers into/(out of) Level 3 |
||||||
Transfers into Level 3 |
| 7 | | 65 | ||
Transfers out of Level 3 |
(47) | (26) | ||||
| | | | | | | |
Total transfers into/(out of) Level 3: |
| (40) | | 39 | ||
| | | | | | | |
Balance at December 31 |
$ | 292 | $ | 331 | ||
| | | | | | | |
Separate account investments in securities partnerships, real estate, and hedge funds are generally valued based on the separate account's ownership share of the equity of the investee (NAV as a practical expedient), including changes in the fair values of its underlying investments. Substantially all of these assets support the Cigna Pension Plans. The following table provides additional information on these investments.
| |
|
|
|
Data as of December 31, 2017 and 2016 | ||||||||||
|---|---|---|---|---|---|---|---|---|---|---|---|---|---|---|
| |
Fair Value as of | Unfunded Commitments as of December 31, 2017 |
||||||||||||
| (In millions) |
December 31, 2017 |
December 31, 2016 |
Redemption Frequency (if currently eligible) |
Redemption Notice Period |
||||||||||
| | | | | | | | | | | | | | | |
Securities partnerships |
$ | 458 | $ | 424 | $ | 365 | Not applicable | | Not applicable | |||||
Real estate funds |
239 | 231 | – | Quarterly | 45–90 days | |||||||||
Hedge funds |
| 77 | | 201 | | – | Up to annually, varying by fund | | 30–90 days | |||||
| | | | | | | | | | | | | | | |
Total |
$ | 774 | $ | 856 | $ | 365 | ||||||||
| | | | | | | | | | | | | | | |
B. Assets and Liabilities Measured at Fair Value under Certain Conditions |
Some financial assets and liabilities are not carried at fair value each reporting period, but may be measured using fair value only under certain conditions, such as investments in real estate, partnership entities and commercial mortgage loans when they become impaired. Impaired values for these asset types classified as Level 3 representing less than 1% of total investments, were written down to their fair values, resulting in immaterial realized investment losses in 2017 and 2016.
| 84 CIGNA CORPORATION - 2017 Form 10-K | | |
PART II
ITEM 8. Financial Statements and Supplementary Data
C. Fair Value Disclosures for Financial Instruments Not Carried at Fair Value |
The following table includes the Company's financial instruments not recorded at fair value that are subject to fair value disclosure requirements at December 31, 2017 and 2016. In addition to universal life products and capital leases, financial instruments that are carried in the Company's Consolidated Financial Statements at amounts that approximate fair value are excluded from the following table.
| |
Classification in |
December 31, 2017 |
December 31, 2016 |
|||||||||||
|---|---|---|---|---|---|---|---|---|---|---|---|---|---|---|
| | | | | | | | | | | | | | | |
(In millions) |
Fair Value Hierarchy |
Fair Value | Carrying Value |
Fair Value | Carrying Value |
|||||||||
| | | | | | | | | | | | | | | |
Commercial mortgage loans |
Level 3 | $ | 1,766 | $ | 1,761 | $ | 1,682 | $ | 1,666 | |||||
Contractholder deposit funds, excluding universal life products |
Level 3 | $ | 1,121 | $ | 1,119 | $ | 1,215 | $ | 1,212 | |||||
Long-term debt, including current maturities, excluding capital leases |
Level 2 | $ | 5,730 | $ | 5,321 | $ | 5,460 | $ | 4,991 | |||||
| | | | | | | | | | | | | | | |
The fair values for all financial instruments presented in the table above have been estimated using market information when available. The following valuation methodologies and inputs are used by the Company to determine fair value.
Commercial mortgage loans. The Company estimates the fair value of commercial mortgage loans generally by discounting the contractual cash flows at estimated market interest rates that reflect the Company's assessment of the credit quality of the loans. Market interest rates are derived by calculating the appropriate spread over comparable U.S. Treasury rates based on the property type, quality rating and average life of the loan. The quality ratings reflect the relative risk of the loan considering debt service coverage, the loan-to-value ratio and other factors. Fair values of impaired mortgage loans are based on the estimated fair value of the underlying collateral generally determined using an internal discounted cash flow model. The fair value measurements were classified in Level 3 because the cash flow models incorporate significant unobservable inputs.
Contractholder deposit funds, excluding universal life products. Generally, these funds do not have stated maturities. Approximately 70% of these balances can be withdrawn by the customer at any time without prior notice or penalty. The fair value for these contracts is the amount estimated to be payable to the customer as of the reporting date, which is generally the carrying value. Most of the remaining contractholder deposit funds are reinsured by the buyers of the individual life and annuity and retirement benefits businesses. The fair value for these contracts is determined using the fair value of these buyers' assets supporting these reinsured contracts. The Company had reinsurance recoverables equal to the carrying value of these reinsured contracts. These instruments were classified in Level 3 because certain inputs are unobservable (supported by little or no market activity) and significant to their resulting fair value measurement.
Long-term debt, including current maturities, excluding capital leases. The fair value of long-term debt is based on quoted market prices for recent trades. When quoted market prices are not available, fair value is estimated using a discounted cash flow analysis and the Company's estimated current borrowing rate for debt of similar terms and remaining maturities. These measurements were classified in Level 2 because the fair values are based on quoted market prices or other inputs that are market observable or can be corroborated by market data.
Fair values of off-balance sheet financial instruments were not material as of December 31, 2017 and 2016.
NOTE 11 Investments, Investment Income and Gains and Losses |
Cigna's investment portfolio consists of a broad range of investments including fixed maturities and equity securities, commercial mortgage loans, other long-term investments and short-term investments. The sections below provide more detail regarding our accounting policies, investment balances, net investment income and realized investment gains and losses. See Note 10 for information about the valuation of the Company's investment portfolio.
A. Investment Portfolio |
Fixed Maturities and Equity Securities |
Accounting policy. Fixed maturities (including bonds, mortgage and other asset-backed securities and preferred stocks redeemable by the investor) and most equity securities are classified as available for sale and are carried at fair value with changes in fair value recorded in accumulated other comprehensive income (loss) within shareholders' equity. Net unrealized appreciation on investments supporting the Company's run-off settlement annuity business is reported in future policy benefit liabilities rather than accumulated other comprehensive income (loss).
Equity securities include hybrid investments consisting of preferred stock with call features that are carried at fair value with changes in fair value reported in other realized investment gains (losses) and dividends reported in net investment income. As of December 31, 2017, fair values of these securities were $49 million and amortized cost was $61 million. As of December 31, 2016, fair values of these securities were $36 million and amortized cost was $49 million.
The Company records impairment losses in net income for fixed maturities with fair value below amortized cost that meet either of the following conditions:
| | | CIGNA CORPORATION - 2017 Form 10-K 85 |
PART II
ITEM 8. Financial Statements and Supplementary Data
The amortized cost and fair value by contractual maturity periods for fixed maturities were as follows at December 31, 2017:
| (In millions) |
Amortized Cost |
Fair Value |
||||
|---|---|---|---|---|---|---|
| | | | | | | |
Due in one year or less |
$ | 1,511 | $ | 1,522 | ||
Due after one year through five years |
6,655 | 6,848 | ||||
Due after five years through ten years |
| 9,377 | | 9,599 | ||
Due after ten years |
3,855 | 4,672 | ||||
Mortgage and other asset-backed securities |
| 469 | | 497 | ||
| | | | | | | |
Total |
$ | 21,867 | $ | 23,138 | ||
| | | | | | | |
Actual maturities of these securities could differ from their contractual maturities used in the table above. This could occur because issuers may have the right to call or prepay obligations, with or without penalties.
Gross unrealized appreciation (depreciation) on fixed maturities by type of issuer is shown below.
| (In millions) | Amortized Cost |
Unrealized Appreciation |
Unrealized Depreciation |
Fair Value | ||||||||
| | | | | | | | | | | | | |
| December 31, 2017 | ||||||||||||
| Federal government and agency | $ | 541 | $ | 239 | $ | (1) | $ | 779 | ||||
| State and local government | 1,196 | 93 | (2) | 1,287 | ||||||||
| Foreign government | | 2,360 | | 142 | | (15) | | 2,487 | ||||
| Corporate | 17,301 | 868 | (81) | 18,088 | ||||||||
| Mortgage and other asset-backed | | 469 | | 29 | | (1) | | 497 | ||||
| | | | | | | | | | | | | |
| Total | $ | 21,867 | $ | 1,371 | $ | (100) | $ | 23,138 | ||||
| | | | | | | | | | | | | |
| Investments supporting liabilities of the Company's run-off settlement annuity business (included in above total) (1) | $ | 2,200 | $ | 681 | $ | (2) | $ | 2,879 | ||||
| | | | | | | | | | | | | |
| December 31, 2016 | ||||||||||||
| Federal government and agency | $ | 658 | $ | 223 | $ | (4) | $ | 877 | ||||
| State and local government | 1,342 | 99 | (6) | 1,435 | ||||||||
| Foreign government | | 1,998 | | 129 | | (14) | | 2,113 | ||||
| Corporate | 15,483 | 716 | (149) | 16,050 | ||||||||
| Mortgage and other asset-backed | | 461 | | 29 | | (4) | | 486 | ||||
| | | | | | | | | | | | | |
| Total | $ | 19,942 | $ | 1,196 | $ | (177) | $ | 20,961 | ||||
| | | | | | | | | | | | | |
| Investments supporting liabilities of the Company's run-off settlement annuity business (included in above total) (1) | $ | 2,196 | $ | 539 | $ | (15) | $ | 2,720 | ||||
| | | | | | | | | | | | | |
As of December 31, 2017, the Company had commitments to purchase $118 million of fixed maturities, all of which bear interest at a fixed market rate.
Review of declines in fair value. Management reviews fixed maturities with a decline in fair value from cost for impairment based on criteria that include:
Based on this review, management believes the unrealized depreciation below to be temporary, and therefore has not impaired these amounts. The table below summarizes fixed maturities with a decline in fair value from amortized cost by the length of time these securities have been in an unrealized loss position.
|
December 31, 2017 | |||||||||||||||||||||||
| | | | | | | | | | | | | | | | | | | | | | | | | |
(Dollars in millions) |
Fair Value |
Amortized Cost |
Unrealized Depreciation |
Number of Issues |
Fair Value |
Amortized Cost |
Unrealized Depreciation |
Number of Issues |
||||||||||||||||
| | | | | | | | | | | | | | | | | | | | | | | | | |
One year or less |
| | | | | | | | ||||||||||||||||
Investment grade |
$ | 3,272 | $ | 3,309 | $ | (37) | 797 | $ | 4,346 | $ | 4,475 | $ | (129) | 992 | ||||||||||
Below investment grade |
$ | 543 | $ | 553 | $ | (10) | | 643 | $ | 724 | $ | 736 | $ | (12) | | 591 | ||||||||
More than one year |
||||||||||||||||||||||||
Investment grade |
$ | 1,503 | $ | 1,549 | $ | (46) | | 373 | $ | 308 | $ | 327 | $ | (19) | | 53 | ||||||||
Below investment grade |
$ | 155 | $ | 162 | $ | (7) | 42 | $ | 186 | $ | 203 | $ | (17) | 28 | ||||||||||
| | | | | | | | | | | | | | | | | | | | | | | | | |
There were no available for sale equity securities with a significant unrealized loss reflected in accumulated other comprehensive income at December 31, 2017.
| 86 CIGNA CORPORATION - 2017 Form 10-K | | |
PART II
ITEM 8. Financial Statements and Supplementary Data
Mortgage loans held by the Company are made exclusively to commercial borrowers and are diversified by property type, location and borrower. Loans are generally issued at a fixed rate of interest and are secured by high quality, primarily completed and substantially leased operating properties.
Accounting policy. Commercial mortgage loans are carried at unpaid principal balances or, if impaired, the lower of unpaid principal or fair value of the underlying real estate. See the "Impaired commercial mortgage loans" section below for the Company's accounting policy for impaired commercial mortgage loans.
At December 31, commercial mortgage loans were distributed among the following property types and geographic regions:
(In millions) |
2017 | 2016 | ||||
| | | | | | | |
Property type |
| | ||||
Office buildings |
$ | 652 | $ | 592 | ||
Apartment buildings |
| 608 | | 428 | ||
Industrial |
197 | 302 | ||||
Hotels |
| 141 | | 205 | ||
Retail facilities |
135 | 139 | ||||
Other |
| 28 | | – | ||
| | | | | | | |
Total |
$ | 1,761 | $ | 1,666 | ||
| | | | | | | |
U.S. geographic region |
| | ||||
Pacific |
$ | 841 | $ | 714 | ||
South Atlantic |
| 210 | | 268 | ||
New England |
238 | 227 | ||||
Central |
| 237 | | 239 | ||
Middle Atlantic |
203 | 186 | ||||
Mountain |
| 32 | | 32 | ||
| | | | | | | |
Total |
$ | 1,761 | $ | 1,666 | ||
| | | | | | | |
As of December 31, 2017, approximately 86% of the Company's commercial mortgage loan portfolio is scheduled to mature in 2022 or thereafter.
Actual maturities could differ from contractual maturities for several reasons: borrowers may have the right to prepay obligations with or without prepayment penalties; the maturity date may be extended; and loans may be refinanced.
As of December 31, 2017, the Company had commitments to extend credit under commercial mortgage loan agreements of $21 million.
Credit quality. The Company regularly evaluates and monitors credit risk, beginning with the initial underwriting of a mortgage loan and continuing throughout the investment holding period. Mortgage origination professionals employ an internal credit quality rating system designed to evaluate the relative risk of the transaction at origination that is then updated each year as part of the annual portfolio loan review. The Company evaluates and monitors credit quality on a consistent and ongoing basis, classifying each loan as a loan in good standing, potential problem loan or problem loan.
Quality ratings are based on our evaluation of a number of key inputs related to the loan, including real estate market-related factors such as rental rates and vacancies, and property-specific inputs such as growth rate assumptions and lease rollover statistics. However, the two most significant contributors to the credit quality rating are the debt service coverage and loan-to-value ratios. The debt service coverage ratio measures the amount of property cash flow available to meet annual interest and principal payments on debt, with a ratio below 1.0 indicating that there is not enough cash flow to cover the required loan payments. The loan-to-value ratio, commonly expressed as a percentage, compares the amount of the loan to the fair value of the underlying property collateralizing the loan.
The following table summarizes the credit risk profile of the Company's commercial mortgage loan portfolio based on loan-to-value and debt service coverage ratios, as of December 31, 2017 and 2016:
| 2017 | 2016 |
|||||||||||||||||
| | | | | | | | | | | | | | | | | | | |
| (Dollars in millions) Loan-to-Value Ratio |
Carrying Value |
Average Debt Service Coverage Ratio |
Average Loan-to- Value Ratio |
Carrying Value |
Average Debt Service Coverage Ratio |
Average Loan-to- Value Ratio |
||||||||||||
| | | | | | | | | | | | | | | | | | | |
| Below 60% | $ | 1,109 | | 2.03 | | | $ | 943 | | 2.06 | | | ||||||
| 60% to 79% | 652 | 2.24 | 702 | 1.89 | ||||||||||||||
| 80% to 100% | | – | | – | | | | 21 | | – | | | ||||||
| | | | | | | | | | | | | | | | | | | |
| Total | $ | 1,761 | 2.11 | 57% | $ | 1,666 | 1.95 | 57% | ||||||||||
| | | | | | | | | | | | | | | | | | | |
The Company's annual in-depth review of its commercial mortgage loan investments is the primary mechanism for identifying emerging risks in the portfolio. The most recent review was completed by the Company's investment professionals in the second quarter of 2017 and included an analysis of each underlying property's most recent annual financial statements, rent rolls, operating plans, budgets, a physical inspection of the property and other pertinent factors. Based on historical results, current leases, lease expirations and rental conditions in each market, the Company estimates the current year and future stabilized property income and fair value for each loan.
| | | CIGNA CORPORATION - 2017 Form 10-K 87 |
PART II
ITEM 8. Financial Statements and Supplementary Data
The Company will reevaluate a loan's credit quality between annual reviews if new property information is received or an event such as delinquency or a borrower's request for restructure causes management to believe that the Company's estimate of financial performance, fair value or the risk profile of the underlying property has been impacted.
Impaired commercial mortgage loans. A commercial mortgage loan is considered impaired when it is probable that the Company will not collect all amounts due according to the terms of the original loan agreement. These loans are included in either problem or potential problem loans. The Company monitors credit risk and assesses the impairment of loans individually and on a consistent basis for all loans in the portfolio. Impaired loans are carried at the lower of unpaid principal balance or the fair value of the underlying real estate. The Company estimates the fair value of the underlying real estate using internal valuations generally based on discounted cash flow analyses. Certain commercial mortgage loans without valuation reserves are considered impaired because the Company will not collect all interest due according to the terms of the original agreements; however, the Company expects to recover the unpaid principal because it is less than the fair value of the underlying real estate. Because of the risk profile of the underlying investment, the Company recognizes interest income on impaired mortgage loans only when payment is actually received.
As of December 31, 2017 and 2016, impaired commercial mortgage loans and valuation reserves associated with impaired loans were not material. For the years ended December 31, 2017 and 2016, the average recorded investment in impaired loans and interest income on impaired loans were not material.
Other Long-Term Investments |
Accounting policy. Other long-term investments include investments in unconsolidated entities. These entities include certain limited partnerships and limited liability companies holding real estate, securities or loans. These investments are carried at cost plus the Company's ownership percentage of reported income or loss in cases where the Company has significant influence; otherwise the investment is carried at cost. Income from certain entities is reported on a one quarter lag depending on when their financial information is received. Other long-term investments are considered impaired, and written down to their fair value, when cash flows indicate that the carrying value may not be recoverable. Fair value is generally determined based on a discounted cash flow analysis.
Other long-term investments also include investment real estate carried at depreciated cost less any impairment write downs to fair value when cash flows indicate that the carrying value may not be recoverable. Depreciation is generally recorded using the straight-line method based on the estimated useful life of each asset. Investment real estate as of December 31, 2017 and 2016 is expected to be held longer than one year and includes real estate acquired through the foreclosure of commercial mortgage loans.
Additionally, other long-term investments include interest rate and foreign currency swaps carried at fair value. See Note 12 for information on the Company's accounting policies for these derivative financial instruments.
Other long-term investments and related commitments are diversified by issuer, property type and geographic regions. The following table provides unfunded commitment and fair value information on these investments. The Company expects to disburse approximately 31% of the committed amounts in 2018.
|
Fair value as of December 31, | Unfunded Commitments as of |
|||||||
| | | | | | | | | | |
(In millions) |
2017 | 2016 | December 31, 2017 | ||||||
| | | | | | | | | | |
Real estate investments |
$ | 591 | $ | 738 | $ | 270 | |||
Securities partnerships |
863 | 650 | 876 | ||||||
Other |
| 64 | | 74 | | 32 | |||
| | | | | | | | | | |
Total |
$ | 1,518 | $ | 1,462 | $ | 1,178 | |||
| | | | | | | | | | |
Short-Term Investments and Cash Equivalents |
Accounting policy. Security investments with maturities of greater than three months to one year from time of purchase are classified as short-term, available for sale and carried at fair value that approximates cost. Cash equivalents consist of short-term investments with maturities of three months or less from the time of purchase and are carried at cost that approximates fair value.
Short-term investments and cash equivalents included the following types of issuers:
(In millions) |
December 31, 2017 |
December 31, 2016 |
||||
| | | | | | | |
Corporate securities |
$ | 1,143 | $ | 2,234 | ||
Federal government securities |
$ | 604 | $ | 378 | ||
Foreign government securities |
$ | 159 | $ | 94 | ||
Money market funds |
$ | 12 | $ | 11 | ||
| | | | | | | |
Concentration of Risk |
As of December 31, 2017 and 2016, the Company did not have a concentration of investments in a single issuer or borrower exceeding 10% of shareholders' equity.
| 88 CIGNA CORPORATION - 2017 Form 10-K | | |
PART II
ITEM 8. Financial Statements and Supplementary Data
B. Net Investment Income |
Accounting policy. When interest and principal payments on investments are current, the Company recognizes interest income when it is earned. The Company recognizes interest income on a cash basis when interest payments are delinquent based on contractual terms or when certain terms (interest rate or maturity date) of the investment have been restructured.
The components of pre-tax net investment income for the years ended December 31 were as follows:
| (In millions) | 2017 | 2016 | 2015 |
|||||||
| | | | | | | | | | | |
| Fixed maturities | $ | 946 | $ | 899 | $ | 879 | ||||
| Equity securities | 14 | 4 | 3 | |||||||
| Commercial mortgage loans | | 81 | | 91 | | 112 | ||||
| Policy loans | 69 | 72 | 72 | |||||||
| Other long-term investments | | 124 | | 98 | | 116 | ||||
| Short-term investments and cash | 42 | 26 | 14 | |||||||
| | | | | | | | | | | |
| Total investment income | | 1,276 | | 1,190 | | 1,196 | ||||
| Less investment expenses | 50 | 43 | 43 | |||||||
| | | | | | | | | | | |
| Net investment income | $ | 1,226 | $ | 1,147 | $ | 1,153 | ||||
| | | | | | | | | | | |
| Net investment income for separate accounts(1) | $ | 225 | $ | 236 | $ | 262 | ||||
| | | | | | | | | | | |
Real estate investments and securities partnerships with a carrying value of $191 million at December 31, 2017 and $220 million at December 31, 2016 were non-income producing during the preceding twelve months.
C. Realized Investment Gains And Losses |
Accounting policy. Realized investment gains and losses are based on specifically identified assets and result from sales, investment asset write-downs, changes in the fair values of certain derivatives and changes in valuation reserves on commercial mortgage loans.
The following realized gains and losses on investments for the years ended December 31 exclude amounts required to adjust future policy benefits for the run-off settlement annuity business.
| (In millions) | 2017 | 2016 | 2015 |
|||||||
| | | | | | | | | | | |
| Fixed maturities | $ | 25 | $ | 23 | $ | (82 | ) | |||
| Equity securities | 52 | (1 | ) | 36 | ||||||
| Commercial mortgage loans | | (1 | ) | | 4 | | (2 | ) | ||
| Other investments, including derivatives | 161 | 143 | 105 | |||||||
| | | | | | | | | | | |
| Net realized investment gains, before income taxes | | 237 | | 169 | | 57 | ||||
| Less income taxes | 81 | 60 | 17 | |||||||
| | | | | | | | | | | |
| Net realized investment gains | $ | 156 | $ | 109 | $ | 40 | ||||
| | | | | | | | | | | |
Included in the realized investment gains and losses in the above table were pre-tax asset write-downs on debt securities and other asset write-downs of $31 million for the year ended December 31, 2017, $58 million for the year ended December 31, 2016 and $140 million for the year ended December 31, 2015. Realized investment gains in other investments, including derivatives, represent primarily gains on sale of real estate properties held in joint ventures.
Realized investment gains that are excluded from the Company's revenues for the years ended December 31 were as follows:
| (In millions) | 2017 | 2016 | 2015 |
|||||||
| | | | | | | | | | | |
| Separate accounts | $ | 157 | $ | 16 | $ | 117 | ||||
| Investment gains required to adjust future policy benefits for the run-off settlement annuity business | $ | 20 | $ | 63 | $ | 114 | ||||
| | | | | | | | | | | |
The following table presents sales information for available-for-sale fixed maturities and equity securities for the years ended December 31. Gross gains on sales and gross losses on sales exclude amounts required to adjust future policy benefits for the run-off settlement annuity business.
| (In millions) | 2017 | 2016 | 2015 |
||||||
| | | | | | | | | | |
| Proceeds from sales | $ | 2,012 | $ | 1,544 | $ | 1,555 | |||
| Gross gains on sales | $ | 103 | $ | 83 | $ | 85 | |||
| Gross losses on sales | $ | (18) | $ | (7) | $ | (13) | |||
| | | | | | | | | | |
NOTE 12 Derivative Financial Instruments |
The Company uses derivative financial instruments to manage the characteristics of investment assets (such as duration, yield, currency and liquidity) to meet the varying demands of the related insurance and contractholder liabilities (such as paying claims, investment returns and withdrawals) and to hedge interest rate risk of its long-term debt. The Company has written and purchased GMIB reinsurance contracts in its run-off reinsurance business that are accounted for as freestanding derivatives and further discussed in Note 9. Derivatives in the Company's
| | | CIGNA CORPORATION - 2017 Form 10-K 89 |
PART II
ITEM 8. Financial Statements and Supplementary Data
separate accounts are excluded from the following discussion because associated gains and losses generally accrue directly to separate account policyholders.
Accounting policy. The Company applies hedge accounting when derivatives are designated, qualified and highly effective as hedges. Effectiveness is formally assessed and documented at inception and each period throughout the life of a hedge using various quantitative methods appropriate for each hedge, including regression analysis and dollar offset. Under hedge accounting, the changes in fair value of the derivative and the hedged risk are generally recognized together and offset each other when reported in shareholders' net income. Changes in the fair value of a derivative instrument may not always equal changes in the fair value of the hedged item. This is referred to as "hedge ineffectiveness" and is generally recorded in realized investment gains and losses. In the event of an early hedge termination, the changes in fair value of derivatives that qualified for hedge accounting are reported in shareholders' net income, generally as a part of realized investment gains and losses. Derivative cash flows are generally reported in operating activities.
The following tables provide information on the Company's specific applications of derivative financial instruments during the years ended December 31.
| | | | | | | | | | | |
| Fair Value Hedge of Long-Term Corporate Debt | Notional Value (in millions) | |||||||||
| | | | | | | | | | | |
| Type of instrument. Interest rate swap contracts | 2017 | 2016 | ||||||||
| | | | | | | | | | | |
| $ 750 | $ 750 | |||||||||
| | | | | | | | | | | |
| | | | | | | | | | | |
| Purpose. To convert a portion of the interest rate exposure on the Company's long-term debt from fixed to variable rates. This more closely aligns the Company's interest expense with the interest income received on its cash equivalent and short-term investment balances. The variable rates are benchmarked to LIBOR. | ||||||||||
| | | | | | | | | | | |
| | | | | | | | | | | |
| Terms of derivative instruments. The Company provides upfront margin and settles fair value changes and net interest between variable and fixed rates daily with a central clearinghouse. | ||||||||||
| | | | | | | | | | | |
| | | | | | | | | | | |
| Accounting. Using fair value hedge accounting, the fair values of the swap contracts are reported in other assets, including other intangibles, or accounts payable, accrued expenses, and other liabilities. The critical terms of these swaps match those of the long-term debt being hedged. As a result, the carrying value of the hedged debt is adjusted to reflect changes in its fair value driven by LIBOR. The effects of those adjustments on other operating expenses are offset by the effects of corresponding changes in the swaps' fair value. The net impact from the hedge reported in other operating expenses reflects interest expense on the hedged debt at the variable interest rate. | ||||||||||
| | | | | | | | | | | |
| | | | | | | | | | | |
| Fair Value Hedges of Fixed Maturity Bonds | Notional Value (in millions) | |||||||||
| | | | | | | | | | | |
| Type of instrument. Foreign currency swap contracts | 2017 | 2016 | ||||||||
| | | | | | | | | | | |
| $ 318 | $ 78 | |||||||||
| | | | | | | | | | | |
| | | | | | | | | | | |
| Purpose. To hedge the foreign exchange related changes in fair values of the Company's fixed maturity bonds. | ||||||||||
| | | | | | | | | | | |
| Terms of derivative instruments. The Company periodically exchanges cash flows between two currencies for both principal and interest. Foreign currency swaps are Euros and British pounds and have terms for up to twelve years. | ||||||||||
| | | | | | | | | | | |
| | | | | | | | | | | |
| Accounting. Using fair value hedge accounting, fair values are reported in other long-term investments or accounts payable, accrued expenses, and other liabilities. Changes in fair values of the swap contracts, as well as changes in the fair values of the hedged bonds attributable to the hedged risk, are reported in other realized investment gains and losses. | ||||||||||
| | | | | | | | | | | |
| | | | | | | | | | | |
| Economic Hedges of a Fixed Maturity Bond Portfolio | Notional Value (in millions) | |||||||||
| | | | | | | | | | | |
| Type of instrument. Foreign currency forward contracts | 2017 | 2016 | ||||||||
| | | | | | | | | | | |
| $ 255 | $ 149 | |||||||||
| | | | | | | | | | | |
| | | | | | | | | | | |
| Purpose. To hedge the foreign exchange related changes in fair values of a U.S. dollar-denominated fixed maturity bond portfolio to reflect the local currency for one of the Company's foreign subsidiaries. | ||||||||||
| | | | | | | | | | | |
| | | | | | | | | | | |
| Terms of derivative instruments. The Company agrees to purchase South Korean won in exchange for U.S. dollars at a future date, generally within three months from the contracts' trade dates. | ||||||||||
| | | | | | | | | | | |
| | | | | | | | | | | |
| Accounting. As these arrangements were not designated as accounting hedges, fair values are reported in short-term investments or accounts payable, accrued expenses, and other liabilities, and changes in fair values are reported in other realized investment gains and losses. | ||||||||||
| | | | | | | | | | | |
As of and for the years ended December 31, 2017 and 2016, the effects of these derivative instruments on the Consolidated Financial Statements were not material, including the amounts of gains or losses reclassified from accumulated other comprehensive income into shareholders' net income. No material amounts were excluded from the assessment of hedge effectiveness and no significant gains or losses were recognized due to hedge ineffectiveness.
Collateral and termination features. The Company routinely monitors exposure to credit risk associated with derivatives and diversifies the portfolio among approved dealers of high credit quality to minimize this risk. As of December 31, 2017, the Company had $9 million in cash on
| 90 CIGNA CORPORATION - 2017 Form 10-K | | |
PART II
ITEM 8. Financial Statements and Supplementary Data
deposit representing the upfront margin required for the Company's centrally-cleared derivative instruments. Certain of the Company's over-the-counter derivative instruments contain provisions requiring either the Company or the counterparty to post collateral or demand immediate payment depending on the amount of the net liability position and predefined financial strength or credit rating thresholds. Collateral posting requirements vary by counterparty. The net asset or liability positions of these derivatives were not material as of December 31, 2017 or 2016.
When the Company becomes involved with a variable interest entity, as well as when there is a change in the Company's involvement with an entity, the Company must determine if it is the primary beneficiary and must consolidate the entity. The Company would be considered the primary beneficiary if it has the power to direct the entity's most significant economic activities or has the right to receive benefits or obligation to absorb losses that could be significant to the entity. The Company evaluates the following criteria:
As of December 31, 2017 and 2016, the Company determined it was not a primary beneficiary in any material variable interest entities. The Company's involvement in variable interest entities where it is not the primary beneficiary is described below.
Securities limited partnerships and real estate limited partnerships. The Company owns interests in securities limited partnerships and real estate limited partnerships that are defined as variable interest entities. These partnerships invest in the equity or mezzanine debt of privately held companies and real estate properties. General partners unaffiliated with the Company control decisions that most significantly impact the partnership's operations and the limited partners do not have substantive kick-out or participating rights. The Company's maximum exposure to these entities of $2.4 billion across approximately 116 limited partnerships as of December 31, 2017 includes $1.2 billion reported in other long-term investments and commitments to contribute an additional $1.2 billion. The Company's non-controlling interest in each of these limited partnerships is generally less than 10% of the partnership ownership interests.
Other asset-backed and corporate securities. In the normal course of its investing activities, the Company also makes passive investments in certain asset-backed and corporate securities that are issued by variable interest entities whose sponsors or issuers are unaffiliated with the Company. The Company receives fixed-rate cash flows from these investments and the maximum potential exposure to loss is limited to the carrying amount of $0.6 billion as of December 31, 2017 that is reported in fixed maturities. The Company's combined ownership interests are insignificant relative to the total principal amounts issued by these entities.
The Company is also involved in real estate joint ventures, independent physician associations ("IPAs") and a joint venture in India that are variable interest entities. The carrying values and maximum exposures associated with these arrangements are immaterial.
The Company has not provided, and does not intend to provide, financial support to any of the above entities that it is not contractually required to provide. The Company performs ongoing qualitative analyses of its involvement with these variable interest entities to determine if consolidation is required.
| | | CIGNA CORPORATION - 2017 Form 10-K 91 |
PART II
ITEM 8. Financial Statements and Supplementary Data
NOTE 14 Accumulated Other Comprehensive Income (Loss) ("AOCI") |
AOCI includes the Company's share from entities accounted for using the equity method. AOCI excludes amounts required to adjust future policy benefits for the run-off settlement annuity business and a portion of deferred acquisition costs associated with the corporate-owned life insurance business. Changes in the components of accumulated other comprehensive income (loss) were as follows:
| (in millions) | 2017 | 2016 | 2015 |
|||||||
| | | | | | | | | | | |
| Securities | | | | |||||||
Beginning balance |
$ | 362 | $ | 418 | $ | 620 | ||||
Appreciation (depreciation) on securities |
| 35 | | (48 | ) | | (389 | ) | ||
Tax (expense) benefit |
(19 | ) | 6 | 157 | ||||||
| | | | | | | | | | | |
Net appreciation (depreciation) on securities |
| 16 | | (42 | ) | | (232 | ) | ||
| | | | | | | | | | | |
Reclassification adjustment for (gains) losses included in shareholders' net income (net realized investment gains) |
(77 | ) | (22 | ) | 46 | |||||
Tax benefit (expense) |
| 27 | | 8 | | (16 | ) | |||
| | | | | | | | | | | |
Net (gains) losses reclassified from AOCI to net income |
(50 | ) | (14 | ) | 30 | |||||
| | | | | | | | | | | |
Other comprehensive (loss), net of tax |
| (34 | ) | | (56 | ) | | (202 | ) | |
| | | | | | | | | | | |
| Ending balance | $ | 328 | $ | 362 | $ | 418 | ||||
| | | | | | | | | | | |
| Derivatives | | | | |||||||
| Beginning balance | $ | 3 | $ | 7 | $ | (8 | ) | |||
(Depreciation) appreciation on derivatives |
| (1 | ) | | – | | 10 | |||
Tax (expense) |
– | – | (3 | ) | ||||||
| | | | | | | | | | | |
Net (depreciation) appreciation on derivatives |
| (1 | ) | | – | | 7 | |||
| | | | | | | | | | | |
Reclassification adjustment for losses included in shareholders' net income (other operating expenses) |
1 | 1 | 12 | |||||||
Reclassification adjustment for (gains) included in shareholders' net income (net realized investment gains) |
| (4 | ) | | (7 | ) | | – | ||
Tax benefit (expense) |
1 | 2 | (4 | ) | ||||||
| | | | | | | | | | | |
Net (gains) losses reclassified from AOCI to net income |
| (2 | ) | | (4 | ) | | 8 | ||
| | | | | | | | | | | |
Other comprehensive (loss) income , net of tax |
(3 | ) | (4 | ) | 15 | |||||
| | | | | | | | | | | |
| Ending balance | $ | – | $ | 3 | $ | 7 | ||||
| | | | | | | | | | | |
| Translation of foreign currencies | ||||||||||
| Beginning balance | $ | (369 | ) | $ | (274 | ) | $ | (62 | ) | |
Translation of foreign currencies |
309 | (95 | ) | (224 | ) | |||||
Tax (expense) benefit |
| (5 | ) | | – | | 12 | |||
| | | | | | | | | | | |
Net translation of foreign currencies |
304 | (95 | ) | (212 | ) | |||||
| | | | | | | | | | | |
| Ending balance | $ | (65 | ) | $ | (369 | ) | $ | (274 | ) | |
| | | | | | | | | | | |
| Postretirement benefits liability | ||||||||||
| Beginning balance | $ | (1,378 | ) | $ | (1,401 | ) | $ | (1,486 | ) | |
Reclassification adjustment for amortization of net losses from past experience and prior service costs (other operating expenses) |
64 | 64 | 68 | |||||||
Reclassification adjustment for settlement (other operating expenses) |
| 7 | | – | | – | ||||
Tax (expense) benefit |
(24 | ) | (22 | ) | (23 | ) | ||||
| | | | | | | | | | | |
Net adjustments reclassified from AOCI to net income |
| 47 | | 42 | | 45 | ||||
| | | | | | | | | | | |
Valuation update |
(22 | ) | (29 | ) | 63 | |||||
Tax benefit (expense) |
| 8 | | 10 | | (23 | ) | |||
| | | | | | | | | | | |
Net change due to valuation update |
(14 | ) | (19 | ) | 40 | |||||
| | | | | | | | | | | |
Other comprehensive income (loss), net of tax |
| 33 | | 23 | | 85 | ||||
| | | | | | | | | | | |
| Ending balance | $ | (1,345 | ) | $ | (1,378 | ) | $ | (1,401 | ) | |
| | | | | | | | | | | |
NOTE 15 Pension and Other Postretirement Benefit Plans |
A. About our Plans |
Pension plans. The Company's principal qualified defined benefit pension plans, the Cigna Pension Plan and the Cigna Pension Plan for Certain Former Employees, cover approximately 22,200 retirees, 14,500 vested former employees and 14,000 active employees. Current retirees, certain vested former employees and longer-service active employees are entitled to an annuity benefit based on pay and length of service. Most pension-eligible active employees and certain vested former employees are entitled to a cash balance defined benefit. The Cigna Supplemental Pension Plan, a non-qualified and unfunded plan, covers only certain employees. We froze future benefit accruals for all of these domestic pension plans in 2009. Additionally the Company has foreign pension and other postretirement benefit plans that are immaterial to our results of operations, liquidity and financial position.
As further discussed in Note 21, Cigna Corporation and the Cigna Pension Plan are defendants in a class action lawsuit related to the Plan's conversion of certain employees from an annuity to a cash balance benefit in 1997. When the required plan amendment related to this litigation is adopted, the pension benefit obligation will be updated to reflect benefits resulting from this litigation.
| 92 CIGNA CORPORATION - 2017 Form 10-K | | |
PART II
ITEM 8. Financial Statements and Supplementary Data
Other postretirement benefit plans. The Company's postretirement benefit medical plan covers approximately 18,400 retirees and 18,600 active employees. Post-1988 retirees contribute to the cost of this coverage, whereas pre-1989 retirees do not. For post-1988 retirees, the Company's cost is capped at 200% of the per capita cost in 2000. Pharmacy coverage for Medicare-eligible retirees is delivered using an Employer Group Waiver Plan. Under that plan, the Company receives subsidies from CMS. The postretirement medical plan is unfunded and future benefit accruals were frozen in 2013. The Company also offers certain postretirement life insurance benefits through various plans. Retirees do not contribute to the cost of life insurance benefits.
Accounting policy. The Company measures the assets and liabilities of its domestic pension and other postretirement benefit plans as of December 31. Benefit obligations are measured at the present value of estimated future payments based on actuarial assumptions. The Company uses the "corridor" method to account for changes in the benefit obligation when actual results differ from those assumed, or when assumptions change. These changes are called net unrecognized actuarial gains (losses). Under the corridor method, net unrecognized actuarial gains (losses) are initially recorded in accumulated other comprehensive income. When the unrecognized gain (loss) exceeds 10% of the benefit obligation, that excess is amortized to other operating expense over the expected remaining lives of plan participants.
For balance sheet purposes, we measure plan assets at fair value. When the actual return differs from the expected return, those differences are reflected in the net unrealized actuarial gain (loss) discussed above. However, to measure pension benefit costs, we use a "market-related" asset valuation that differs from the actual fair value for domestic pension plan assets invested in non-fixed income investments. The "market-related" value recognizes the difference between actual and expected long-term returns in the portfolio over five years, a method that reduces the short-term impact of market fluctuations on pension costs. At December 31, 2017, the market-related asset value was approximately $4.1 billion compared with a fair value of approximately $4.3 billion.
B. Funded Status and Amounts Included in Accumulated Other Comprehensive Income |
The following table summarizes the projected benefit obligations and assets related to our domestic and international pension and other postretirement benefit plans as of, and for the years ended, December 31:
| Pension Benefits | Other Postretirement Benefits |
|||||||||||
| | | | | | | | | | | | | |
| (In millions) | 2017 | 2016 | 2017 | 2016 |
||||||||
| | | | | | | | | | | | | |
| Change in benefit obligation | | | | | ||||||||
| Benefit obligation, January 1 | $ | 4,888 | $ | 4,934 | $ | 277 | $ | 295 | ||||
| Service cost | | 3 | | 2 | | – | | – | ||||
| Interest cost | 186 | 199 | 9 | 11 | ||||||||
| Loss from past experience | | 181 | (1) | | 57 | (1) | | 1 | | 2 | ||
| Benefits paid from plan assets | (277 | ) | (284 | ) | (3) | (3) | ||||||
| Benefits paid – other | | (12 | ) | | (20 | ) | | (26) | | (28) | ||
| | | | | | | | | | | | | |
| Benefit obligation, December 31 | 4,969 | 4,888 | 258 | 277 | ||||||||
| | | | | | | | | | | | | |
| Change in plan assets | | | | | ||||||||
| Fair value of plan assets, January 1 | 3,977 | 3,981 | 5 | 8 | ||||||||
| Actual return on plan assets | | 418 | | 279 | | – | | – | ||||
| Benefits paid | (277 | ) | (284 | ) | (3) | (3) | ||||||
| Contributions | | 163 | | 1 | | – | | – | ||||
| | | | | | | | | | | | | |
| Fair value of plan assets, December 31 | 4,281 | 3,977 | 2 | 5 | ||||||||
| | | | | | | | | | | | | |
| Funded status | $ | (688 | ) | $ | (911 | ) | $ | (256) | $ | (272) | ||
| | | | | | | | | | | | | |
We fund our qualified pension plans at least at the minimum amount required by the Employee Retirement Income Security Act of 1974 and the Pension Protection Act of 2006. For 2018, we do not expect to make any contributions to the qualified pension plans because none are required. Future years' contributions will ultimately be based on a wide range of factors including but not limited to asset returns, discount rates and funding targets. Non-qualified pension and other postretirement benefit plans are generally funded on a pay-as-you-go basis as there are no plan assets for these plans.
Benefit payments. The following benefit payments are expected to be paid in:
| (In millions) | Pension Benefits |
Other Postretirement Benefits |
||||
| | | | | | | |
| 2018 | $ | 340 | $ | 27 | ||
| 2019 | $ | 334 | $ | 26 | ||
| 2020 | $ | 325 | $ | 25 | ||
| 2021 | $ | 325 | $ | 23 | ||
| 2022 | $ | 324 | $ | 22 | ||
| 2023-2027 | $ | 1,573 | $ | 87 | ||
| | | | | | | |
| | | CIGNA CORPORATION - 2017 Form 10-K 93 |
PART II
ITEM 8. Financial Statements and Supplementary Data
Amounts reflected in the pension and other postretirement benefit liabilities shown above that have not yet been reported in net income and therefore are included in accumulated other comprehensive loss consisted of the following as of December 31:
| Pension Benefits | Other Postretirement Benefits |
|||||||||||
| | | | | | | | | | | | | |
| (In millions) | 2017 | 2016 | 2017 | 2016 |
||||||||
| | | | | | | | | | | | | |
| Unrecognized net (losses) | $ | (2,113 | ) | $ | (2,163 | ) | $ | – | $ | – | ||
| Unrecognized prior service cost | (6 | ) | (6 | ) | 46 | 49 | ||||||
| | | | | | | | | | | | | |
| Postretirement benefits liability adjustment | $ | (2,119 | ) | $ | (2,169 | ) | $ | 46 | $ | 49 | ||
| | | | | | | | | | | | | |
We expect to recognize pre-tax losses of $69 million in 2018 from amortization of the net actuarial loss in our pension plans and pre-tax gains of $3 million in 2018 from amortization of prior service cost in the other postretirement benefit plans. These estimates are based on a weighted average amortization period for the frozen and inactive plans that is based on the average expected remaining life of plan participants of approximately 26 years.
C. Cost of Our Plans |
Components of net pension and other postretirement benefits cost for the years ended December 31 were as follows:
| Pension Benefits | Other Postretirement Benefits |
|||||||||||||||||
| | | | | | | | | | | | | | | | | | | |
| (In millions) | 2017 | 2016 | 2015 | 2017 | 2016 | 2015 |
||||||||||||
| | | | | | | | | | | | | | | | | | | |
| Service cost | $ | 3 | $ | 2 | $ | 2 | $ | – | $ | – | $ | – | ||||||
| Interest cost | 186 | 199 | 194 | 9 | 11 | 11 | ||||||||||||
| Expected long-term return on plan assets | | (260 | ) | | (249 | ) | | (267) | | – | | – | | – | ||||
| Amortization of: | ||||||||||||||||||
Net loss from past experience |
| 66 | | 65 | | 70 | | 1 | | 1 | | – | ||||||
Prior service cost |
– | 1 | – | (3 | ) | (3 | ) | (3) | ||||||||||
| Settlement loss | | 7 | | – | | – | | – | | – | | – | ||||||
| | | | | | | | | | | | | | | | | | | |
| Net plan cost | $ | 2 | $ | 18 | $ | (1) | $ | 7 | $ | 9 | $ | 8 | ||||||
| | | | | | | | | | | | | | | | | | | |
D. Assumptions Used for Pension and Other Postretirement Benefit Plans |
Management determined the present value of the projected benefit obligation and the accumulated other postretirement benefit obligation and related benefit costs based on the following weighted average assumptions as of and for the years ended December 31:
| 2017 | 2016 |
|||
| | | | | |
| Discount rate: | ||||
Pension benefit obligation |
3.51% | 3.95% | ||
Other postretirement benefit obligation |
3.37% | 3.70% | ||
Pension benefit cost |
3.95% | 4.17% | ||
Other postretirement benefit cost |
3.70% | 3.89% | ||
| Expected long-term return on plan assets: | ||||
Pension benefit cost |
7.25% | 7.25% | ||
Other postretirement benefit cost |
5.00% | 5.00% | ||
| Mortality table for pension and postretirement benefit obligations |
RP 2014 with MP 2017 projection scale |
RP 2014 with MP 2016 projection scale |
||
| | | | | |
The Company used the Society of Actuaries mortality table RP2014 and the updated improvement scales published in 2016 and 2017 to value its benefit obligations because the Company's mortality experience closely matched these tables based on internal studies. The updated improvement scales published in 2016 and 2017 both indicated that mortality improvement is expected to be lower than was originally projected when the study was first published in 2014, resulting in decreases to the benefit obligations in both years.
The Company sets discount rates by applying actual annualized yields for high quality bonds at various durations to the expected cash flows of the pension and other postretirement benefits liabilities. A discount rate curve is constructed using an array of bonds in various industries throughout the domestic market, but only selects those for the curve that have an above average return at each duration. Management believes that this curve is representative of the yields that the Company is able to achieve through its plan asset investment strategy.
Expected long-term rates of return on plan assets were developed considering actual long-term historical returns, expected long-term market conditions, plan asset mix and management's investment strategy that continues a significant allocation to domestic and foreign equity securities as well as securities partnerships, real estate and hedge funds. Expected long-term market conditions take into consideration certain key macroeconomic trends including expected domestic and foreign GDP growth, employment levels and inflation.
The estimated rate of future increases in the per capita cost of postretirement health care benefits is 6.50% in 2018, decreasing by 0.25% per year to 4.75% in 2024 and beyond. The impact of a 1% increase or decrease in the estimated rate would be immaterial to postretirement cost and benefit obligation.
| 94 CIGNA CORPORATION - 2017 Form 10-K | | |
PART II
ITEM 8. Financial Statements and Supplementary Data
E. Pension Plan Assets |
As of December 31, 2017, pension assets included $3.9 billion invested in the separate accounts of Connecticut General Life Insurance Company and Life Insurance Company of North America, subsidiaries of the Company, as well as an additional $342 million invested directly in funds offered by the buyer of the retirement benefits business.
The fair values of pension assets by category are as follows as of December 31, 2017 and 2016.
| (In millions) | 2017 | 2016 |
||||
| | | | | | | |
| Fixed maturities: | | | ||||
Federal government and agency |
$ | 1 | $ | 1 | ||
Corporate |
| 1,124 | | 1,125 | ||
Asset-backed |
22 | 22 | ||||
Fund investments |
| 884 | | 630 | ||
| | | | | | | |
| Total fixed maturities | 2,031 | 1,778 | ||||
| | | | | | | |
| Equity securities: | | | ||||
Domestic |
689 | 681 | ||||
International, including funds and pooled separate accounts(1) |
| 476 | | 350 | ||
| | | | | | | |
| Total equity securities | 1,165 | 1,031 | ||||
| | | | | | | |
| Securities partnerships | | 457 | | 424 | ||
| Real estate funds, including pooled separate accounts(1) | 300 | 289 | ||||
| Commercial mortgage loans | | 140 | | 129 | ||
| Hedge funds | 73 | 196 | ||||
| Guaranteed deposit account contract | | 63 | | 67 | ||
| Cash equivalents and other current assets, net | 52 | 63 | ||||
| | | | | | | |
| Total pension assets at fair value | $ | 4,281 | $ | 3,977 | ||
| | | | | | | |
The Company's current target investment allocation percentages (50% fixed income, 30% public equity securities and 20% in other investments, including private equity (securities partnerships), real estate and hedge funds) are developed by management as guidelines, although the fair values of each asset category are expected to vary as a result of changes in market conditions. The Company would expect to further reduce the allocation to equity securities and other investments and increase the allocation to fixed income investments as funding levels improve.
See Note 10 for further details regarding how fair value is determined, including the level within the fair value hierarchy and the procedures we use to validate fair value measurements. Within pension plan assets, the Company classifies substantially all fixed maturities in Level 2. These assets are valued using recent trades of similar securities or are fund investments priced using their daily net asset value that is the exit price. Within pension assets, a substantial portion of domestic equity securities are classified as Level 1, while international equity funds are predominantly classified in Level 2 using daily net asset value.
Securities partnerships, real estate and hedge funds are valued using NAV as a practical expedient and are excluded from the fair value hierarchy. See Note 10 for additional disclosures related to these assets invested in the separate accounts of the Company's subsidiaries. Certain securities as described in Note 10, as well as commercial mortgage loans and guaranteed deposit account contracts, are classified in Level 3 because unobservable inputs used in their valuation are significant.
F. 401(k) Plans |
The Company sponsors a 401(k) plan in which the Company matches a portion of employees' pre-tax contributions. Participants in the plan may invest in various funds that invest in the Company's common stock, several diversified stock funds, a bond fund or a fixed-income fund.
The Company may elect to increase its matching contributions if the Company's annual performance meets certain targets. The Company's annual expense for these plans was as follows:
| (In millions) | 2017 | 2016 | 2015 |
||||||
| | | | | | | | | | |
| Expense | $ | 122 | $ | 113 | $ | 106 | |||
| | | | | | | | | | |
NOTE 16 Employee Incentive Plans |
A. About Our Plans
The People Resources Committee ("the Committee") of the Board of Directors awards stock options, restricted stock, deferred stock and strategic performance shares ("SPS") to certain employees. The Committee has issued common stock instead of cash compensation. The Company issues shares from Treasury stock for these awards.
The Company records compensation expense for stock and option awards over their vesting periods primarily based on the estimated fair value at the grant date. Fair value is determined differently for each type of award as discussed below.
Shares of common stock available for award at December 31 were as follows:
| (In millions) | 2017 | 2016 | 2015 |
||||||
| | | | | | | | | | |
| Common shares available for award | | 14.0 | | 6.8 | | 8.6 | |||
| | | | | | | | | | |
| | | CIGNA CORPORATION - 2017 Form 10-K 95 |
PART II
ITEM 8. Financial Statements and Supplementary Data
B. Stock Options |
Accounting policy. The Company awards options to purchase Cigna common stock at the market price of the stock on the grant date. Options vest over periods ranging from one to three years and expire no later than 10 years from grant date. Fair value is estimated using the Black-Scholes option-pricing model by applying the assumptions presented below. That fair value is reduced by options expected to be forfeited during the vesting period. The Company estimates forfeitures at the grant date based on our experience and adjusts the expense to reflect actual forfeitures over the vesting period. The fair value of options, net of forfeitures, is recognized in operating expenses on a straight line basis over the vesting period.
Compensation cost for stock options recorded in operating expenses was as follows for the years ended December 31:
| (In millions) | 2017 | 2016 | 2015 |
||||||
| | | | | | | | | | |
| Stock options compensation cost | $ | 52 | $ | 53 | $ | 42 | |||
| | | | | | | | | | |
Black-Scholes option-pricing model assumptions and the resulting fair value of options are presented in the following table.
| 2017 | 2016 | 2015 |
|||||||
| | | | | | | | | | |
| Dividend yield | | 0.0% | | 0.0% | | 0.0% | |||
| Expected volatility | 35.0% | 35.0% | 35.0% | ||||||
| Risk-free interest rate | | 1.8% | | 1.2% | | 1.3% | |||
| Expected option life | 4.3 years | 4.3 years | 4.3 years | ||||||
| Weighted average fair value of options | $ | 46.38 | $ | 42.01 | $ | 36.40 | |||
| | | | | | | | | | |
The expected volatility reflects the past daily stock price volatility of Cigna stock. The Company does not consider volatility implied in the market prices of traded options to be a good indicator of future volatility because remaining traded options will expire within one year. The risk-free interest rate is derived using the four-year U.S. Treasury bond yield rate as of the award date for the primary annual grant. Expected option life reflects the Company's historical experience.
The following table shows the status of, and changes in, common stock options during the last three years.
| 2017 | 2016 | 2015 |
|||||||||||||||||
| | | | | | | | | | | | | | | | | | | | |
| (Options in thousands) | Options | Weighted Average Exercise Price |
Options | Weighted Average Exercise Price |
Options | Weighted Average Exercise Price |
|||||||||||||
| | | | | | | | | | | | | | | | | | | | |
| Outstanding – January 1 | | 7,097 | $ | 82.01 | | 6,433 | $ | 68.86 | | 7,331 | $ | 51.84 | |||||||
Granted |
1,230 | $ | 149.17 | 1,336 | $ | 139.20 | 1,410 | $ | 120.94 | ||||||||||
Exercised |
| (2,072) | $ | 63.41 | | (577) | $ | 62.09 | | (2,146) | $ | 43.63 | |||||||
Expired or canceled |
(99) | $ | 138.41 | (95) | $ | 117.18 | (162) | $ | 86.04 | ||||||||||
| | | | | | | | | | | | | | | | | | | | |
| Outstanding – December 31 | | 6,156 | $ | 100.79 | | 7,097 | $ | 82.01 | | 6,433 | $ | 68.86 | |||||||
| | | | | | | | | | | | | | | | | | | | |
| Options exercisable at year-end | 3,894 | $ | 77.36 | 4,409 | $ | 58.36 | 3,414 | $ | 46.55 | ||||||||||
| | | | | | | | | | | | | | | | | | | | |
Compensation expense of $39 million related to unvested stock options at December 31, 2017 will be recognized over the next two years (weighted average period).
The table below summarizes information for stock options exercised during the last three years:
(In millions) |
2017 | 2016 | 2015 |
||||||
| | | | | | | | | | |
Intrinsic value of options exercised |
$ | 218 | $ | 41 | $ | 179 | |||
Cash received for options exercised |
$ | 131 | $ | 36 | $ | 94 | |||
Tax benefit from options exercised |
$ | 41 | $ | 11 | $ | 42 | |||
| | | | | | | | | | |
The following table summarizes information for outstanding common stock options at December 31, 2017:
|
Options Outstanding |
Options Exercisable |
||||
| | | | | | | |
Number (in thousands) |
| 6,156 | | 3,894 | ||
Total intrinsic value (in millions) |
$ | 630 | $ | 490 | ||
Weighted average exercise price |
$ | 100.79 | $ | 77.36 | ||
Weighted average remaining contractual life |
6.6 | 5.5 | ||||
| | | | | | | |
C. Restricted Stock |
The Company awards restricted stock to the Company's employees with vesting periods ranging from three to five years. Recipients of restricted stock awards accumulate dividends during the vesting period, but forfeit their awards and accumulated dividends if their employment terminates before the vesting date.
Accounting policy. Fair value of restricted stock awards is equal to the market price of Cigna's common stock on the date of grant. This fair value is reduced by awards that are expected to forfeit. At the grant date, the Company estimates forfeitures based on experience and adjusts
| 96 CIGNA CORPORATION - 2017 Form 10-K | | |
PART II
ITEM 8. Financial Statements and Supplementary Data
the expense to reflect actual forfeitures over the vesting period. This fair value, net of forfeitures, is recognized in other operating expenses over the vesting period on a straight line basis.
Compensation cost for restricted stock awards was as follows for the years ended December 31:
(In millions) |
2017 | 2016 | 2015 |
||||||
| | | | | | | | | | |
Restricted stock compensation cost |
$ | 53 | $ | 40 | $ | 33 | |||
| | | | | | | | | | |
The following table shows the status of, and changes in, restricted stock awards during the last three years.
| 2017 | 2016 | 2015 |
|||||||||||||||||
| | | | | | | | | | | | | | | | | | | | |
| (Awards in thousands) | Grants/Units | Weighted Average Fair Value at Award Date |
Grants/Units | Weighted Average Fair Value at Award Date |
Grants/Units | Weighted Average Fair Value at Award Date |
|||||||||||||
| | | | | | | | | | | | | | | | | | | | |
| Outstanding – January 1 | | 1,309 | $ | 97.78 | | 1,642 | $ | 72.58 | | 2,121 | $ | 53.59 | |||||||
Awarded |
451 | $ | 155.21 | 315 | $ | 138.61 | 352 | $ | 121.93 | ||||||||||
Vested |
| (409) | $ | 67.09 | | (591) | $ | 50.01 | | (736) | $ | 41.99 | |||||||
Forfeited |
(56) | $ | 121.74 | (57) | $ | 92.51 | (95) | $ | 68.31 | ||||||||||
| | | | | | | | | | | | | | | | | | | | |
| Outstanding – December 31 | | 1,295 | $ | 126.44 | | 1,309 | $ | 97.78 | | 1,642 | $ | 72.58 | |||||||
| | | | | | | | | | | | | | | | | | | | |
The fair value of vested restricted stock at the vesting date for the years ended December 31 was as follows:
(In millions) |
2017 | 2016 | 2015 |
||||||
| | | | | | | | | | |
Fair value of vested restricted stock |
$ | 62 | $ | 82 | $ | 92 | |||
| | | | | | | | | | |
At the end of 2017, approximately 4,800 employees held 1.3 million restricted stock awards with $68 million of related compensation expense to be recognized over the next two years (weighted average period).
D. Strategic Performance Shares ("SPS") |
The Company awards SPSs to executives and certain other key employees generally with a performance period of three years. Half of these shares are subject to a market condition (total shareholder return relative to industry peer companies) and half are subject to a performance condition (cumulative adjusted net income). These targets are set by the Committee. At the end of the performance period, holders of SPSs are awarded shares of Cigna common stock ranging anywhere from 0 to 200% of the original grant of SPSs.
Accounting policy. Compensation expense for SPSs is recorded over the performance period. For "market condition" SPSs, fair value is determined at the grant date using a Monte Carlo simulation model and not subsequently adjusted regardless of the final outcome. For "performance condition" SPSs, expense is initially accrued based on the most likely outcome, but evaluated for adjustment each period for updates in the expected outcome. At the end of the performance period, expense is adjusted to the actual outcome (number of shares awarded times the share price at the grant date). At the grant date, the Company estimates forfeitures based on experience and adjusts the expense to reflect actual forfeitures over the vesting period.
Compensation expense for SPSs was as follows for the years ended December 31:
(In millions) |
2017 | 2016 | 2015 |
||||||
| | | | | | | | | | |
Strategic performance shares compensation cost |
$ | 40 | $ | 35 | $ | 36 | |||
| | | | | | | | | | |
The following table shows the status of, and changes in, SPSs during the last three years:
| 2017 | 2016 | 2015 |
|||||||||||||||||
| | | | | | | | | | | | | | | | | | | | |
| (Awards in thousands) | Shares | Weighted Average Fair Value at Award Date |
Shares | Weighted Average Fair Value at Award Date |
Shares | Weighted Average Fair Value at Award Date |
|||||||||||||
| | | | | | | | | | | | | | | | | | | | |
| Outstanding – January 1 | | 942 | $ | 109.14 | | 1,188 | $ | 81.68 | | 1,547 | $ | 59.20 | |||||||
Awarded |
275 | $ | 150.06 | 286 | $ | 139.05 | 311 | $ | 121.78 | ||||||||||
Vested |
| (386) | $ | 78.91 | | (494) | $ | 60.15 | | (608) | $ | 45.51 | |||||||
Forfeited |
(53) | $ | 138.19 | (38) | $ | 112.70 | (62) | $ | 76.33 | ||||||||||
| | | | | | | | | | | | | | | | | | | | |
| Outstanding – December 31 | | 778 | $ | 136.57 | | 942 | $ | 109.14 | | 1,188 | $ | 81.68 | |||||||
| | | | | | | | | | | | | | | | | | | | |
The fair value of vested SPSs at the vesting date for the years ended December 31 was as follows:
|
2017 | 2016 | 2015 |
||||||||||||||||
| | | | | | | | | | | | | | | | | | | | |
(Shares in thousands; $ in millions) |
Shares | Fair Value | Shares | Fair Value | Shares | Fair Value |
|||||||||||||
| | | | | | | | | | | | | | | | | | | | |
Shares of Cigna common stock distributed upon SPS vesting |
| 476 | $ | 70 | | 768 | $ | 109 | | 972 | $ | 119 | |||||||
| | | | | | | | | | | | | | | | | | | | |
| | | CIGNA CORPORATION - 2017 Form 10-K 97 |
PART II
ITEM 8. Financial Statements and Supplementary Data
At the end of 2017, approximately 1,500 employees held 778,000 SPSs and $38 million of related compensation expense is expected to be recognized over the next two years. For "performance condition" SPSs, the amount of expense may vary based on actual performance in 2018 and 2019.
E. One-Time Employee Stock Award |
In 2017, the Company granted most employees a one-time stock award of five shares that immediately vested. In connection with this program, approximately 205,000 shares were issued at a price of $162.96, resulting in a pre-tax cost of $33 million.
F. Compensation Cost and Tax Effects of Share-based Compensation |
During the vesting period, the Company records tax benefits in shareholders' net income based on the amount of expense being recognized. When stock options are exercised, or when restricted stock and SPSs vest, the difference between tax benefits based on the expense and the actual tax benefit realized are also recorded in net income beginning in 2016 in accordance with ASU 2016-09. Prior to 2016, such excess tax benefits were recorded as an adjustment to additional paid-in capital. The table below provides information about the cost and tax benefits related to all of our share-based compensation arrangements discussed above.
(In millions) |
2017 | 2016 | 2015 |
||||||
| | | | | | | | | | |
Total compensation cost for shared-based awards |
$ | 178 | $ | 128 | $ | 111 | |||
Tax benefits recognized |
$ | 79 | $ | 57 | $ | 24 | |||
| | | | | | | | | | |
NOTE 17 Goodwill, Other Intangibles and Property and Equipment |
A. Goodwill |
Accounting policy. Goodwill represents the excess of the cost of businesses acquired over the fair value of their net assets. The resulting goodwill is assigned to those reporting units expected to realize cash flows from the acquisition, allocated to reporting units based on relative fair values, primarily reported in the Global Health Care segment ($5.9 billion) and, to a lesser extent, the Global Supplemental Benefits segment ($0.3 billion).
The Company evaluates goodwill for impairment at least annually during the third quarter at the reporting unit level and writes it down through shareholders' net income if impaired. Fair value of a reporting unit is generally estimated based on either market data or a discounted cash flow analysis using assumptions that the Company believes a hypothetical market participant would use to determine a current transaction price. The significant assumptions and estimates used in determining fair value include the discount rate and future cash flows. A range of discount rates is used that corresponds with the reporting unit's weighted average cost of capital, consistent with that used for investment decisions considering the specific and detailed operating plans and strategies within the reporting unit. Projections of future cash flows for the reporting unit are consistent with our annual planning process for revenues, claims, operating expenses, taxes, capital levels and long-term growth rates.
Goodwill activity. Goodwill activity during 2017 and 2016 was as follows:
(In millions) |
2017 | 2016 |
||||
| | | | | | | |
Balance at January 1, |
$ | 5,980 | $ | 6,019 | ||
Goodwill acquired, net |
154 | 1 | ||||
Impact of foreign currency translation |
| 30 | | (40) | ||
| | | | | | | |
Balance at December 31, |
$ | 6,164 | $ | 5,980 | ||
| | | | | | | |
B. Other Intangibles |
Accounting policy. The Company's other intangible assets include purchased customer and producer relationships, provider networks and trademarks. The fair value of purchased customer relationships and the amortization method were determined as of the dates of purchase using an income approach that relies on projected future net cash flows including key assumptions for the customer attrition rate and discount rate. The Company amortizes other intangibles on an accelerated or straight-line basis over periods from five to 30 years. Management revises amortization periods if it believes there has been a change in the length of time that an intangible asset will continue to have value. Costs incurred to renew or extend the terms of these intangible assets are generally expensed as incurred.
| 98 CIGNA CORPORATION - 2017 Form 10-K | | |
PART II
ITEM 8. Financial Statements and Supplementary Data
Components of other assets, including other intangibles. Other intangible assets were comprised of the following at December 31:
(In millions) |
Cost | Accumulated Amortization |
Net Carrying Value |
||||||
| | | | | | | | | | |
2017 |
| | | ||||||
Customer relationships |
$ | 1,280 | $ | 1,056 | $ | 224 | |||
Other |
| 291 | | 170 | | 121 | |||
| | | | | | | | | | |
Total reported in other assets, including other intangibles |
1,571 | 1,226 | 345 | ||||||
Value of business acquired (reported in deferred policy acquisition costs) |
| 232 | | 86 | | 146 | |||
| | | | | | | | | | |
Total other intangible assets |
$ | 1,803 | $ | 1,312 | $ | 491 | |||
| | | | | | | | | | |
2016 |
| | | ||||||
Customer relationships |
$ | 1,256 | $ | 965 | $ | 291 | |||
Other |
| 284 | | 151 | | 133 | |||
| | | | | | | | | | |
Total reported in other assets, including other intangibles |
1,540 | 1,116 | 424 | ||||||
Value of business acquired (reported in deferred policy acquisition costs) |
| 232 | | 68 | | 164 | |||
| | | | | | | | | | |
Total other intangible assets |
$ | 1,772 | $ | 1,184 | $ | 588 | |||
| | | | | | | | | | |
C. Property and Equipment |
Accounting policy. Property and equipment is carried at cost less accumulated depreciation. When applicable, cost includes interest, real estate taxes and other costs incurred during construction. Also included in this category is internal-use software that is acquired, developed or modified solely to meet the Company's internal needs, with no plan to market externally. Costs directly related to acquiring, developing or modifying internal-use software are capitalized.
The Company calculates depreciation and amortization principally using the straight-line method generally based on the estimated useful life of each asset as follows: buildings and improvements, 10 to 40 years; purchased software, three to five years; internally developed software, three to seven years; and furniture and equipment (including computer equipment), three to 10 years. Improvements to leased facilities are depreciated over the lesser of the remaining lease term or the estimated life of the improvement. The Company considers events and circumstances that would indicate the carrying value of property, equipment or capitalized software might not be recoverable. If the Company determines the carrying value of any of these assets is not recoverable, an impairment charge is recorded.
Components of property and equipment. Property and equipment was comprised of the following as of December 31:
(In millions) |
Cost | Accumulated Amortization |
Net Carrying Value |
||||||
| | | | | | | | | | |
2017 |
| | | ||||||
Internal-use software |
$ | 2,991 | $ | 2,184 | $ | 807 | |||
Other property and equipment |
| | | ||||||
Assets recorded under capital leases(1) |
49 | 31 | 18 | ||||||
Other property and equipment not recorded under capital leases |
| 1,573 | | 835 | | 738 | |||
| | | | | | | | | | |
Total other property and equipment |
1,622 | 866 | 756 | ||||||
| | | | | | | | | | |
Total property and equipment |
$ | 4,613 | $ | 3,050 | $ | 1,563 | |||
| | | | | | | | | | |
2016 |
|||||||||
Internal-use software |
$ | 2,766 | $ | 1,997 | $ | 769 | |||
Other property and equipment |
|||||||||
Assets recorded under capital leases(1) |
| 87 | | 49 | | 38 | |||
Other property and equipment not recorded under capital leases |
1,511 | 782 | 729 | ||||||
| | | | | | | | | | |
Total other property and equipment |
| 1,598 | | 831 | | 767 | |||
| | | | | | | | | | |
Total property and equipment |
$ | 4,364 | $ | 2,828 | $ | 1,536 | |||
| | | | | | | | | | |
Components of depreciation and amortization. Depreciation and amortization was comprised of the following for the years ended December 31:
(In millions) |
2017 | 2016 | 2015 |
||||||
| | | | | | | | | | |
Internal-use software |
$ | 298 | $ | 303 | $ | 288 | |||
Other property and equipment(1) |
153 | 158 | 160 | ||||||
Value of business acquired (reported in deferred policy acquisition costs) |
| 18 | | 20 | | 18 | |||
Other intangibles(2) |
97 | 129 | 119 | ||||||
| | | | | | | | | | |
Total depreciation and amortization |
$ | 566 | $ | 610 | $ | 585 | |||
| | | | | | | | | | |
The Company estimates annual pre-tax amortization for intangible assets, including internal-use software, over the next five calendar years to be as follows:
(In millions) |
Pre-tax Amortization |
||
| | | | |
2018 |
$ | 387 | |
2019 |
$ | 299 | |
2020 |
$ | 177 | |
2021 |
$ | 114 | |
2022 |
$ | 88 | |
| | | | |
| | | CIGNA CORPORATION - 2017 Form 10-K 99 |
PART II
ITEM 8. Financial Statements and Supplementary Data
NOTE 18 Leases and Rentals |
Description of operating leases. The Company's operating leases are primarily for office space and certain computer and other equipment. Some of these leases include renewal options and other incentives that are amortized over the life of the lease. Leases active in 2017 had terms ranging from one month to 18 years.
Rental expense and payments. For the years ended December 31, net rental expenses for operating leases were approximately:
(In millions) |
2017 | 2016 | 2015 |
||||||
| | | | | | | | | | |
Net rental expense for operating leases |
$ | 162 | $ | 151 | $ | 165 | |||
| | | | | | | | | | |
As of December 31, 2017, future net minimum rental payments under non-cancelable operating leases were approximately $580 million, payable as follows:
(In millions) |
Operating Lease Payments |
||
| | | | |
2018 |
$ | 130 | |
2019 |
$ | 113 | |
2020 |
$ | 94 | |
2021 |
$ | 73 | |
2022 |
$ | 58 | |
2023 and thereafter |
$ | 114 | |
| | | | |
The Company also has capital lease arrangements. See Note 17 and Note 5 for further information on assets recorded under capital leases and the related obligations.
NOTE 19 Shareholders' Equity and Dividend Restrictions |
State insurance departments and foreign jurisdictions that regulate certain of the Company's subsidiaries prescribe accounting practices (differing in some respects from GAAP) to determine statutory net income and surplus. The Company's life, accident and health insurance and Health Maintenance Organization ("HMO") subsidiaries are regulated by such statutory requirements. Due to regulatory changes in the jurisdiction of one of our foreign insurance affiliates, surplus increased significantly in 2017, primarily due to including deferred policy acquisition costs as an admitted asset. The statutory net income of the Company's life, accident and health insurance and HMO subsidiaries for the years ended, and their statutory surplus as of December 31, were as follows:
(In billions) |
2017 | 2016 | 2015 |
||||||
| | | | | | | | | | |
Net income |
$ | 2.5 | $ | 2.0 | $ | 2.1 | |||
Surplus |
$ | 10.4 | $ | 8.5 | $ | 8.0 | |||
| | | | | | | | | | |
The Company's HMO and life, accident and health insurance subsidiaries are also subject to minimum statutory surplus requirements and may be required to maintain investments on deposit with state departments of insurance or other regulatory bodies. Additionally, these subsidiaries may be subject to regulatory restrictions on the amount of annual dividends or other distributions (such as loans or cash advances) that insurance companies may extend to the parent company without prior approval. As of December 31, 2017, these amounts, including restricted GAAP net assets of the Company's subsidiaries, were as follows:
(In billions) |
2017 |
||
| | | | |
Minimum statutory surplus required by regulators |
$ | 3.2 | |
Investments on deposit with regulatory bodies |
$ | 0.6 | |
Maximum dividend distributions permitted in 2018 without regulatory approval |
$ | 1.6 | |
Maximum loans to the parent company permitted without regulatory approval |
$ | 1.3 | |
Restricted GAAP net assets of Cigna Corporation's subsidiaries |
$ | 12.0 | |
| | | | |
There were no permitted practices for the Company's insurance subsidiaries that significantly differed from prescribed regulatory accounting practices.
NOTE 20 Income Taxes |
U.S. Tax Reform Legislation
Major U.S. tax reform legislation was signed into law on December 22, 2017. The legislation is highlighted by a reduction in the corporate income tax rate from the current 35% to 21% effective January 1, 2018. The Company expects a significant decline in its effective tax rate beginning in 2018 as a result of the rate reduction. The remaining provisions of the law, most of which take effect on January 1, 2018, are not expected to have a material impact on the Company's results of operations beginning in 2018.
The Company recorded additional tax expense of $232 million in 2017 resulting from this legislation, comprised of $144 million due to the revaluation of net deferred tax assets to reflect the reduction in the corporate tax rate and $88 million due to the assessment of U.S. taxes related to the Company's accumulated unremitted foreign earnings. The legislation provides an election to pay these taxes over eight years, and we expect to adopt this election. Both the revaluation of deferred tax assets and liabilities and the taxes on accumulated unremitted
| 100 CIGNA CORPORATION - 2017 Form 10-K | | |
PART II
ITEM 8. Financial Statements and Supplementary Data
foreign earnings are considered provisional as permitted under SAB 118 (see Note 2) because certain adjustments used to calculate the taxes at year-end were based on estimates.
Also as a result of tax reform, the Company recorded a reduction in operating expenses of $56 million ($36 million after-tax) reflecting a decrease in a liability to reimburse a reinsurer for taxes related to a block of business sold through reinsurance. An offsetting tax effect is included in the $144 million charge discussed above, resulting in no after-tax effect for this item.
Accounting policy. Deferred income tax assets and liabilities are recognized for differences between the financial and income tax reporting bases of the underlying assets and liabilities and established based upon enacted tax rates and laws, including the U.S. tax reform legislation enacted in December 2017. Deferred income tax assets are recognized when available evidence indicates that realization is more likely than not. The deferred income tax provision generally represents the net change in deferred income tax assets and liabilities during the year, excluding amounts reported as adjustments to accumulated other comprehensive income or amounts initially recorded due to business combinations. The current income tax provision generally represents estimated amounts due on various income tax returns for the year reported plus the effect of any uncertain tax positions. Uncertain tax positions are evaluated in accordance with GAAP.
Income taxes for the Company's foreign operations are provided using the respective foreign jurisdictions' tax rate.
The Company's foreign operations continue to retain a significant portion of their earnings overseas. These undistributed earnings are deployed outside of the United States in support of the liquidity and capital needs of our foreign operations as well as to support growth initiatives overseas. The Company does not intend to repatriate these earnings.
A. Income Tax Expense |
The components of income taxes for the years ended December 31 were as follows:
(In millions) |
2017 | 2016 | 2015 |
||||||
| | | | | | | | | | |
Current taxes |
| | | ||||||
U.S. income taxes |
$ | 974 | $ | 935 | $ | 1,076 | |||
Foreign income taxes |
| 122 | | 95 | | 93 | |||
State income taxes |
36 | 32 | 60 | ||||||
| | | | | | | | | | |
Total current taxes |
| 1,132 | | 1,062 | | 1,229 | |||
| | | | | | | | | | |
Deferred taxes (benefits) |
|||||||||
U.S. income taxes |
| 204 | | 69 | | 22 | |||
Foreign income taxes (benefits) |
39 | 9 | (6) | ||||||
State income taxes (benefits) |
| (1) | | (4) | | 5 | |||
| | | | | | | | | | |
Total deferred taxes |
242 | 74 | 21 | ||||||
| | | | | | | | | | |
Total income taxes |
$ | 1,374 | $ | 1,136 | $ | 1,250 | |||
| | | | | | | | | | |
Total income taxes for the years ended December 31 were different from the amount computed using the nominal federal income tax rate of 35% for the following reasons:
(In millions) |
2017 | 2016 | 2015 |
||||||
| | | | | | | | | | |
Tax expense at nominal rate |
$ | 1,262 | $ | 1,043 | $ | 1,164 | |||
Effect of U.S. tax reform legislation |
232 | – | – | ||||||
Effect of undistributed foreign earnings |
| (70) | | (57) | | (67) | |||
Health insurance industry tax |
– | 108 | 109 | ||||||
State income tax (net of federal income tax benefit) |
| 23 | | 18 | | 42 | |||
Other |
(73) | 24 | 2 | ||||||
| | | | | | | | | | |
Total income taxes |
$ | 1,374 | $ | 1,136 | $ | 1,250 | |||
| | | | | | | | | | |
Consolidated pre-tax income from the Company's foreign operations was approximately 14% of the Company's pre-tax income in 2017. The comparable amount in prior years was 11% in 2016 and 2015. South Korean operations produced approximately 13% of the Company's pre-tax income in 2017, 11% in 2016 and 8% in 2015.
The consolidated effective tax rate was 38.1% in both 2017 and 2016. The additional tax expense associated with the recently enacted U.S. tax reform legislation was offset by the favorable effects of the one-year moratorium on the non-deductible health insurance industry tax and recognizing an incremental tax benefit associated with transaction-related costs that is included in "Other" in the above table.
The Company retains a significant portion of its foreign earnings overseas. If the Company intended to remit these earnings it would have recorded additional deferred tax liabilities of approximately $120 million for foreign withholding taxes. A portion of these taxes may be eligible for credit against the Company's U.S. tax liability.
| | | CIGNA CORPORATION - 2017 Form 10-K 101 |
PART II
ITEM 8. Financial Statements and Supplementary Data
B. Deferred Income Taxes |
Deferred income tax assets and liabilities as of December 31 were as follows:
(In millions) |
2017 | 2016 |
||||
| | | | | | | |
Deferred tax assets |
| | ||||
Employee and retiree benefit plans |
$ | 279 | $ | 481 | ||
Other insurance and contractholder liabilities |
| 352 | | 460 | ||
Net operating losses |
105 | 128 | ||||
Other accrued liabilities |
| 101 | | 166 | ||
Other |
91 | 140 | ||||
| | | | | | | |
Deferred tax assets before valuation allowance |
| 928 | | 1,375 | ||
Valuation allowance for deferred tax assets |
(72) | (87) | ||||
| | | | | | | |
Deferred tax assets, net of valuation allowance |
| 856 | | 1,288 | ||
| | | | | | | |
Deferred tax liabilities |
||||||
Depreciation and amortization |
| 496 | | 781 | ||
Unrealized appreciation on investments and foreign currency translation |
102 | 149 | ||||
Other |
| 225 | | 54 | ||
| | | | | | | |
Total deferred tax liabilities |
823 | 984 | ||||
| | | | | | | |
Net deferred income tax assets |
$ | 33 | $ | 304 | ||
| | | | | | | |
Deferred income tax balances as of December 31, 2017 have been adjusted to reflect the reduced statutory tax rate that took effect as of January 1, 2018 pursuant to the recently enacted U.S. tax reform legislation. The Company has recorded incremental tax expense of $144 million including the adjustment of deferred tax balances related to items reported in accumulated other comprehensive income.
Included in the consolidated net deferred tax asset of $33 million is approximately $175 million of deferred tax liabilities attributable to foreign jurisdictions, most notably South Korea and Taiwan.
Management believes that future results will be sufficient to realize the Company's deferred tax assets. With the exception of certain net operating loss related tax benefits, the Company's deferred tax benefits may be carried forward indefinitely. Net operating loss benefits are primarily attributable to foreign jurisdictions. The Company establishes a valuation allowance when it determines that realization of a deferred tax asset does not meet the more likely than not standard. Valuation allowances have been established against certain federal, foreign and state deferred tax assets, generally when there is a requirement to assess them on a separate entity basis.
C. Uncertain Tax Positions |
A reconciliation of unrecognized tax benefits for the years ended December 31 was as follows:
(In millions) |
2017 | 2016 | 2015 |
||||||
| | | | | | | | | | |
Balance at January 1, |
$ | 31 | $ | 31 | $ | 26 | |||
Increase due to current year positions |
7 | 10 | 7 | ||||||
Reduction related to settlements with taxing authorities |
| (1) | | (2) | | – | |||
Reduction related to lapse of applicable statute of limitations |
(2) | (8) | (2) | ||||||
| | | | | | | | | | |
Balance at December 31, |
$ | 35 | $ | 31 | $ | 31 | |||
| | | | | | | | | | |
D. Other Tax Matters |
The Internal Revenue Service has completed review of the Company's consolidated income tax returns through 2012. The statute of limitations for 2013 has expired, but the Company has filed an amended return for which the pending refund is subject to review. The Company conducts business in a number of state and foreign jurisdictions, and may be engaged in multiple audit proceedings at any given time. Generally, no further state or foreign audit activity is expected for tax years prior to 2011.
NOTE 21 Contingencies and Other Matters |
The Company, through its subsidiaries, is contingently liable for various guarantees provided in the ordinary course of business.
A. Financial Guarantees: Retiree and Life Insurance Benefits |
The Company guarantees that separate account assets will be sufficient to pay certain life insurance or retiree benefits. The sponsoring employers are primarily responsible for ensuring that assets are sufficient to pay these benefits and are required to maintain assets that exceed a certain percentage of benefit obligations. If employers fail to do so, the Company or an affiliate of the buyer of the retirement benefits business (Prudential Retirement Insurance and Annuity Company or "Prudential") has the right to redirect the management of the related assets to provide for benefit payments. As of December 31, 2017, employers maintained assets that exceeded the benefit obligations under these arrangements of approximately $470 million. Approximately 12% of these are reinsured by Prudential. The remaining guarantees are provided by the Company with minimal reinsurance from third parties. The Company establishes an additional liability if management believes
| 102 CIGNA CORPORATION - 2017 Form 10-K | | |
PART II
ITEM 8. Financial Statements and Supplementary Data
that the Company will be required to make payment under the guarantees; there were no additional liabilities required for these guarantees as of December 31, 2017. Separate account assets supporting these guarantees are classified in Levels 1 and 2 of the GAAP fair value hierarchy (see Note 10).
The Company does not expect that these financial guarantees will have a material effect on the Company's consolidated results of operations, liquidity or financial condition.
B. Guaranteed Minimum Income Benefit Contracts |
See Note 9 for discussion.
C. Certain Other Guarantees |
The Company had indemnification obligations to a lender of approximately $90 million as of December 31, 2017, related to a borrowing by a certain real estate joint venture that the Company records as an investment. This borrowing (a nonrecourse obligation of the Company) is secured by the joint venture's real estate property with a fair value in excess of the loan amount and matures in 2021. The Company's indemnification obligation would require payment to the lender for any actual damages resulting from certain acts such as unauthorized ownership transfers, misappropriation of rental payments by others or environmental damages. Based on initial and ongoing reviews of property management and operations, the Company does not expect that payments will be required under this indemnification obligation. Any payment that might be required could be recovered through a refinancing or sale of the assets. The Company also has recourse to the partner for their proportionate share of amounts paid. There were no liabilities required for this indemnification obligation as of December 31, 2017.
The Company had indemnification obligations as of December 31, 2017 in connection with acquisition and disposition transactions. These indemnification obligations are triggered by the breach of representations or covenants provided by the Company, such as representations for the presentation of financial statements, the filing of tax returns, compliance with law or the identification of outstanding litigation. These obligations are typically subject to various time limitations, defined by the contract or by operation of law, such as statutes of limitation. In some cases, the maximum potential amount due is subject to contractual limitations based on a percentage of the transaction purchase price, while in other cases limitations are not specified or applicable. The Company does not believe that it is possible to determine the maximum potential amount due under these obligations because not all amounts due under these indemnification obligations are subject to limitation. There were no liabilities for these indemnification obligations as of December 31, 2017.
D. Guaranty Fund Assessments |
The Company operates in a regulatory environment that may require its participation in assessments under state insurance guaranty association laws. The Company's exposure to assessments for certain obligations of insolvent insurance companies to policyholders and claimants is based on its share of business written in the relevant jurisdictions.
On March 1, 2017, the Commonwealth Court of Pennsylvania entered an order of liquidation of Penn Treaty Network America Insurance Company, together with its subsidiary American Network Insurance Company (collectively "Penn Treaty", a long-term care insurance carrier), triggering guaranty fund coverage and accrual of a liability. For the year ended December 31, 2017, the Company recorded in operating expenses approximately $130 million pre-tax (approximately $85 million after-tax), representing its estimate of the total assessments, net of premium tax offsets for insurance contracts currently written. Some of the assessments were recorded on a discounted basis, using a weighted average discount rate of 3.5%. As of December 31, 2017, the recorded liability was approximately $55 million and total future cash outflows as of December 31, 2017 are expected to approximate $65 million. This assessment is expected to be updated in future periods for changes in the estimate of the insolvency. In addition, a portion of this assessment is expected to be offset in the future by premium tax credits that will be recognized in the period received.
E. Legal and Regulatory Matters |
The Company is routinely involved in numerous claims, lawsuits, regulatory audits, investigations and other legal matters arising, for the most part, in the ordinary course of managing a global health services business. Except for the specific matters noted below, the Company believes that the legal actions, regulatory matters, proceedings and investigations currently pending against it should not have a material adverse effect on the Company's results of operations, financial condition or liquidity based upon our current knowledge and taking into consideration current accruals. Disputed tax matters arising from audits by the Internal Revenue Service ("IRS") or other state and foreign jurisdictions, including those resulting in litigation, are accounted for under GAAP guidance for uncertain tax positions. Further information on income tax matters can be found in Note 20.
Pending litigation and legal or regulatory matters that the Company has identified with a reasonably possible material loss are described below. When litigation and regulatory matters present loss contingencies that are both probable and estimable, the Company accrues the estimated loss by a charge to shareholders' net income. The estimated loss is the Company's best estimate of the probable loss at the time or an amount within a range of estimated losses reflecting the most likely outcome or the minimum amount of the range (if no amount is better than any other estimated amount in the range.) The Company provides disclosure in the aggregate for material pending litigation and legal or regulatory matters, including accruals, range of loss, or a statement that such information cannot be estimated. Due to numerous uncertain factors presented in these cases, it is not possible to estimate an aggregate range of loss (if any) for these matters at this time. In light of the uncertainties involved in these matters, there is no assurance that their ultimate resolution will not exceed the amounts currently accrued by the Company. An adverse outcome in one or more of these matters could be material to the Company's results of operations, financial
| | | CIGNA CORPORATION - 2017 Form 10-K 103 |
PART II
ITEM 8. Financial Statements and Supplementary Data
condition or liquidity for any particular period. The Company had pre-tax reserves as of December 31, 2017 of $195 million ($155 million after-tax) for the matters discussed below under "Litigation Matters." Litigation related to the Company's claim processing practices for a commercial client, for which the Company held a reserve of $40 million pre-tax ($25 million after-tax) at September 30, 2016, was settled for that amount during the fourth quarter of 2016.
Litigation Matters
Amara cash balance pension plan litigation. In December 2001, Janice Amara filed a class action lawsuit in the U.S. District Court for the District of Connecticut against Cigna Corporation and the Cigna Pension Plan (the "Plan") on behalf of herself and other similarly situated Plan participants affected by the 1998 conversion to a cash balance formula. The plaintiffs allege various violations of the Employee Retirement Income Security Act of 1974 ("ERISA"), including that the Plan's cash balance formula discriminates against older employees; that the conversion resulted in a wear-away period (when the pre-conversion accrued benefit exceeded the post-conversion benefit); and that the Plan communications contained inaccurate or inadequate disclosures about these conditions.
In 2008, the District Court (1) affirmed the Company's right to convert to a cash balance plan prospectively beginning in 1998; (2) found for plaintiffs on the disclosure claim only; and (3) required the Company to pay pre-1998 benefits under the pre-conversion traditional annuity formula and post-1997 benefits under the post-conversion cash balance formula. From 2008 through 2015, this case has undergone a series of court proceedings that resulted in the original District Court order being largely upheld. In 2015, the Company submitted to the District Court its proposed method for calculating the additional pension benefits due to class members and plaintiffs responded in August 2015.
In January 2016, the District Court ordered the method of calculating the additional pension benefits due to class members. The court order left several aspects of the calculation of additional plan benefits open to interpretation. From that time through the present, both parties have disputed various aspects of the Court's interpretation and the Court has attempted to clarify. On July 14, 2017, the Court issued a ruling clarifying certain aspects of the January 2016 order. The Plaintiffs filed a motion for reconsideration of the July 14, 2017 ruling that was denied by the Court on November 7, 2017. The Company's reserve for this litigation is adequate at December 31, 2017, based on calculations consistent with the Company's interpretation of the latest guidance from the Court. Due to the continuing inability of the parties to agree on the details of calculating the pension benefits, the final timing of the resolution of this matter remains uncertain. Once these issues are resolved, the Plan will be amended to comply with the District Court's orders and the benefits will begin to be paid.
Ingenix. In April 2004, the Company was sued in a number of putative nationwide class actions alleging that the Company improperly underpaid claims for out-of-network providers through the use of data provided by Ingenix, Inc., a subsidiary of one of the Company's competitors. These actions were consolidated into Franco v. Connecticut General Life Insurance Company, et al., pending in the U.S. District Court for the District of New Jersey. The consolidated amended complaint, filed in 2009 on behalf of subscribers, health care providers and various medical associations, asserted claims related to benefits and disclosure under ERISA, the Racketeer Influenced and Corrupt Organizations ("RICO") Act, the Sherman Antitrust Act and New Jersey state law and seeks recovery for alleged underpayments from 1998 through the present. Other major health insurers have been the subject of, or have settled, similar litigation.
In September 2011, the District Court (1) dismissed all claims by the health care provider and medical association plaintiffs for lack of standing; and (2) dismissed the antitrust claims, the New Jersey state law claims and the ERISA disclosure claim. In January 2013 and again in April 2014, the District Court denied separate motions by the plaintiffs to certify a nationwide class of subscriber plaintiffs. The Third Circuit denied plaintiffs' request for an immediate appeal of the January 2013 ruling. As a result, the case is proceeding on behalf of the named plaintiffs only. In June 2014, the District Court granted the Company's motion for summary judgment to terminate all claims, and denied the plaintiffs' partial motion for summary judgment. In July 2014, the plaintiffs appealed all of the District Court's decisions in favor of the Company, including the class certification decision, to the Third Circuit. On May 2, 2016, the Third Circuit affirmed the District Court's decisions denying class certification for the claims asserted by members, the granting of summary judgment on the individual plaintiffs' claims, as well as the dismissal of the antitrust claims. However, the Third Circuit also reversed the earlier dismissal of the providers' ERISA claims. The Company will continue to vigorously defend its position.
Regulatory Matters
Civil Investigative Demand. The U.S. Department of Justice ("DOJ") is currently conducting an industry review of the risk adjustment data submission practices and business processes, including review of medical charts, of Medicare Advantage organizations under Medicare Parts C and D. In connection with this industry review, in December 2016, the Company received a Civil Investigative Demand from the Civil Division of the DOJ. We are in the process of voluntarily cooperating with the DOJ's request and responding to the information request.
Disability claims regulatory matter. During the second quarter of 2013, the Company finalized an agreement with the Departments of Insurance for Maine, Massachusetts, Pennsylvania, Connecticut and California (together, the "monitoring states") related to the Company's long-term disability claims handling practices. The agreement requires primarily: (1) enhanced procedures related to documentation and disposition and (2) a two-year monitoring period followed by a re-examination that began in the second quarter of 2016. Management believes the Company has addressed the requirements of the agreement. If the monitoring states find material non-compliance with the agreement upon re-examination, the Company may be subject to additional costs and penalties or requests to change its business practices that could negatively impact future earnings for this business.
Other Legal Matters
Litigation with Anthem. In February 2017, the Company delivered a notice to Anthem terminating the merger agreement, and notifying Anthem that it must pay the Company the $1.85 billion reverse termination fee pursuant to the terms of the merger agreement. Also in February 2017, the Company filed suit against Anthem in the Delaware Court of Chancery (the "Chancery Court") seeking declaratory judgments that the Company's termination of the merger agreement was valid and that Anthem was not permitted to extend the termination date. The complaint also sought payment of the reverse termination fee and additional damages in an amount exceeding $13 billion, including the lost premium value to the Company's shareholders caused by Anthem's willful breaches of the merger agreement.
| 104 CIGNA CORPORATION - 2017 Form 10-K | | |
PART II
ITEM 8. Financial Statements and Supplementary Data
Also in February 2017, Anthem filed a lawsuit in the Chancery Court against the Company seeking (i) a temporary restraining order to enjoin Cigna from terminating and taking any action contrary to the terms of the merger agreement, (ii) specific performance compelling Cigna to comply with the merger agreement and (iii) damages.
On February 15, 2017, the Chancery Court granted Anthem's motion for a temporary restraining order and temporarily enjoined the Company from terminating the merger agreement. In May 2017, the Chancery Court denied Anthem's motion for a preliminary injunction to enjoin Cigna from terminating the merger agreement but stayed its ruling pending Anthem's determination as to whether to seek an appeal. Anthem subsequently notified Cigna and the Chancery Court that it did not intend to appeal the Chancery Court's decision. As a result, the merger agreement was terminated.
The litigation between the parties remains pending. Trial is scheduled for 2019. We believe in the merits of our claims and dispute Anthem's claims, and we intend to vigorously defend ourselves and pursue our claims. The outcomes of lawsuits are inherently unpredictable, and we may be unsuccessful in the ongoing litigation or any future claims or litigation.
NOTE 22 Segment Information |
See Note 1 for a description of our reporting segments.
In the Company's segment disclosures, we present "operating revenues," defined as total revenues excluding realized investment results. The Company excludes realized investment results from this measure because its portfolio managers may sell investments based on factors largely unrelated to the underlying business purposes of each segment. As a result, gains or losses created in this process may not be indicative of past or future underlying performance of the business.
The Company uses "adjusted income from operations" as its principal financial measure of segment operating performance because management believes it best reflects the underlying results of business operations and permits analysis of trends in underlying revenue, expenses and profitability. Adjusted income from operations is defined as shareholders' net income excluding after-tax realized investment gains and losses, net amortization of other acquired intangible assets and special items. Income or expense amounts are excluded from adjusted income from operations for the following reasons:
The following table presents the special items recorded by the Company for the years ended December 31, 2017, 2016 and 2015.
| Description of Special Item and Financial Statement Line Item(s) |
After-tax |
Before-tax |
||||
|---|---|---|---|---|---|---|
| (In millions) |
|
|
||||
| | | | | | | |
| Year ended December 31, 2017 | | | ||||
Charges associated with U.S. tax reform |
||||||
– Other operating expenses (see Note 20 for details) |
$ | (36) | $ | (56) | ||
– Tax expense (see Note 20 for details) |
232 | – | ||||
| | | | | | | |
Total charges associated with U.S. tax reform |
$ | 196 | $ | (56) | ||
Debt extinguishment costs (Other operating expenses, see Note 5 for details) |
$ | 209 | $ | 321 | ||
Long-term care guaranty fund assessment (Other operating expenses, see Note 21(D) for details) |
$ | 83 | $ | 129 | ||
Transaction-related costs (Other operating expenses, see Note 3 for details) |
$ | 33 | $ | 126 | ||
| Year ended December 31, 2016 | | | ||||
Transaction-related costs (Other operating expenses, see Note 3 for details) |
$ | 147 | $ | 166 | ||
Risk corridor allowance (Other operating expenses, see page 107 in this Note for details) |
$ | 80 | $ | 124 | ||
Charges associated with litigation matters (Other operating expenses, see Note 21(E) for a discussion of litigation charges) |
$ | 25 | $ | 40 | ||
| Year ended December 31, 2015 | | | ||||
Debt extinguishment costs (Other operating expenses, see Note 5 for details) |
$ | 65 | $ | 100 | ||
Transaction-related costs (Other operating expenses, see Note 3 for details) |
$ | 57 | $ | 66 | ||
| | | | | | | |
| | | CIGNA CORPORATION - 2017 Form 10-K 105 |
PART II
ITEM 8. Financial Statements and Supplementary Data
Summarized segment financial information for the years ended December 31, was as follows:
| (In millions) |
Global Health Care |
Global Supplemental Benefits |
Group Disability and Life |
Other Operations |
Corporate |
Total |
||||||||||||
|---|---|---|---|---|---|---|---|---|---|---|---|---|---|---|---|---|---|---|
| | | | | | | | | | | | | | | | | | | |
2017 |
| | | | | | ||||||||||||
Premiums |
$ | 24,538 | $ | 3,684 | $ | 3,985 | $ | 112 | $ | (12) | $ | 32,307 | ||||||
Fees and other revenues(1) |
| 4,722 | | 66 | | 106 | | 10 | | (37) | | 4,867 | ||||||
Net investment income |
378 | 122 | 350 | 346 | 30 | 1,226 | ||||||||||||
Mail order pharmacy revenues |
| 2,979 | | – | | – | | – | | – | | 2,979 | ||||||
| | | | | | | | | | | | | | | | | | | |
Total operating revenues |
32,617 | 3,872 | 4,441 | 468 | (19) | 41,379 | ||||||||||||
Net realized investment gains (losses) |
| 136 | | 32 | | 74 | | (5) | | – | | 237 | ||||||
| | | | | | | | | | | | | | | | | | | |
Total revenues |
32,753 | 3,904 | 4,515 | 463 | (19) | 41,616 | ||||||||||||
| | | | | | | | | | | | | | | | | | | |
Depreciation and amortization |
| 477 | | 54 | | 30 | | 1 | | 4 | | 566 | ||||||
| | | | | | | | | | | | | | | | | | | |
Total benefits and expenses |
29,440 | 3,407 | 4,044 | 316 | 803 | 38,010 | ||||||||||||
| | | | | | | | | | | | | | | | | | | |
Income (loss) before income taxes |
| 3,313 | | 497 | | 471 | | 147 | | (822) | | 3,606 | ||||||
Income taxes (benefits) and net loss attributable to noncontrolling interests |
1,031 | 195 | 113 | 222 | (192) | 1,369 | ||||||||||||
| | | | | | | | | | | | | | | | | | | |
Shareholders' net income (loss) by segment |
| 2,282 | | 302 | | 358 | | (75) | | (630) | | 2,237 | ||||||
| | | | | | | | | | | | | | | | | | | |
After-tax adjustments to reconcile to adjusted income from operations |
||||||||||||||||||
Net realized investment (gains) losses |
| (88) | | (24) | | (49) | | 4 | | 1 | | (156) | ||||||
Amortization of other acquired intangible assets, net |
48 | 18 | – | – | – | 66 | ||||||||||||
Special items |
| | | | | | ||||||||||||
U.S. tax reform |
(137) | 73 | (39) | 138 | 161 | 196 | ||||||||||||
Debt extinguishment costs |
| – | | – | | – | | – | | 209 | | 209 | ||||||
Long-term care guaranty fund assessment |
68 | – | 15 | – | – | 83 | ||||||||||||
Transaction-related costs |
| – | | – | | – | | – | | 33 | | 33 | ||||||
| | | | | | | | | | | | | | | | | | | |
Adjusted income (loss) from operations |
$ | 2,173 | $ | 369 | $ | 285 | $ | 67 | $ | (226) | $ | 2,668 | ||||||
| | | | | | | | | | | | | | | | | | | |
| (In millions) |
Global Health Care |
Global Supplemental Benefits |
Group Disability and Life |
Other Operations |
Corporate |
Total |
||||||||||||
|---|---|---|---|---|---|---|---|---|---|---|---|---|---|---|---|---|---|---|
| | | | | | | | | | | | | | | | | | | |
2016 |
| | | | | | ||||||||||||
Premiums |
$ | 23,295 | $ | 3,226 | $ | 4,002 | $ | 103 | $ | – | $ | 30,626 | ||||||
Fees and other revenues(1) |
| 4,623 | | 49 | | 98 | | 11 | | (21) | | 4,760 | ||||||
Net investment income |
315 | 110 | 343 | 358 | 21 | 1,147 | ||||||||||||
Mail order pharmacy revenues |
| 2,966 | | – | | – | | – | | – | | 2,966 | ||||||
| | | | | | | | | | | | | | | | | | | |
Total operating revenues |
31,199 | 3,385 | 4,443 | 472 | – | 39,499 | ||||||||||||
Net realized investment gains |
| 119 | | (5) | | 59 | | (5) | | 1 | | 169 | ||||||
| | | | | | | | | | | | | | | | | | | |
Total revenues |
31,318 | 3,380 | 4,502 | 467 | 1 | 39,668 | ||||||||||||
| | | | | | | | | | | | | | | | | | | |
Depreciation and amortization |
| 526 | | 54 | | 28 | | 1 | | 1 | | 610 | ||||||
| | | | | | | | | | | | | | | | | | | |
Total benefits and expenses |
28,467 | 3,052 | 4,273 | 369 | 528 | 36,689 | ||||||||||||
| | | | | | | | | | | | | | | | | | | |
Income (loss) before taxes |
| 2,851 | | 328 | | 229 | | 98 | | (527) | | 2,979 | ||||||
Income taxes (benefits) and net loss attributable to noncontrolling interests |
1,100 | 60 | 65 | 30 | (143) | 1,112 | ||||||||||||
| | | | | | | | | | | | | | | | | | | |
Shareholders' net income (loss) by segment |
| 1,751 | | 268 | | 164 | | 68 | | (384) | | 1,867 | ||||||
| | | | | | | | | | | | | | | | | | | |
After-tax adjustments to reconcile to adjusted income from operations |
||||||||||||||||||
Net realized investment (gains) |
| (78) | | 6 | | (39) | | 2 | | – | | (109) | ||||||
Amortization of other acquired intangible assets, net |
74 | 20 | – | – | – | 94 | ||||||||||||
Special items |
| | | | | | ||||||||||||
Transaction-related costs |
– | – | – | – | 147 | 147 | ||||||||||||
Risk corridor allowance |
| 80 | | – | | – | | – | | – | | 80 | ||||||
Charges associated with litigation matters |
25 | – | – | – | – | 25 | ||||||||||||
| | | | | | | | | | | | | | | | | | | |
Adjusted income (loss) from operations |
$ | 1,852 | $ | 294 | $ | 125 | $ | 70 | $ | (237) | $ | 2,104 | ||||||
| | | | | | | | | | | | | | | | | | | |
| 106 CIGNA CORPORATION - 2017 Form 10-K | | |
PART II
ITEM 8. Financial Statements and Supplementary Data
| (In millions) |
Global Health Care |
Global Supplemental Benefits |
Group Disability and Life |
Other Operations |
Corporate |
Total |
||||||||||||
|---|---|---|---|---|---|---|---|---|---|---|---|---|---|---|---|---|---|---|
| | | | | | | | | | | | | | | | | | | |
2015 |
| | | | | | ||||||||||||
Premiums |
$ | 22,696 | $ | 3,000 | $ | 3,843 | $ | 103 | $ | – | $ | 29,642 | ||||||
Fees and other revenues(1) |
| 4,357 | | 46 | | 91 | | 13 | | (19) | | 4,488 | ||||||
Net investment income |
340 | 103 | 337 | 369 | 4 | 1,153 | ||||||||||||
Mail order pharmacy revenues |
| 2,536 | | – | | – | | – | | – | | 2,536 | ||||||
| | | | | | | | | | | | | | | | | | | |
Total operating revenues |
29,929 | 3,149 | 4,271 | 485 | (15) | 37,819 | ||||||||||||
Net realized investment gains |
| 43 | | – | | 5 | | 9 | | – | | 57 | ||||||
| | | | | | | | | | | | | | | | | | | |
Total revenues |
29,972 | 3,149 | 4,276 | 494 | (15) | 37,876 | ||||||||||||
| | | | | | | | | | | | | | | | | | | |
Depreciation and amortization |
| 526 | | 31 | | 26 | | 1 | | 1 | | 585 | ||||||
| | | | | | | | | | | | | | | | | | | |
Total benefits and expenses |
27,028 | 2,849 | 3,796 | 374 | 502 | 34,549 | ||||||||||||
| | | | | | | | | | | | | | | | | | | |
Income (loss) before taxes |
| 2,944 | | 300 | | 480 | | 120 | | (517) | | 3,327 | ||||||
Income taxes (benefits) and net income attributable to noncontrolling interests |
1,150 | 33 | 152 | 40 | (142) | 1,233 | ||||||||||||
| | | | | | | | | | | | | | | | | | | |
Shareholders' net income (loss) by segment |
| 1,794 | | 267 | | 328 | | 80 | | (375) | | 2,094 | ||||||
| | | | | | | | | | | | | | | | | | | |
After-tax adjustments to reconcile to adjusted income from operations |
||||||||||||||||||
Net realized investment (gains) |
| (30) | | (1) | | (4) | | (5) | | – | | (40) | ||||||
Amortization of other acquired intangible assets, net(2) |
84 | (4) | – | – | – | 80 | ||||||||||||
Special items |
| | | | | | ||||||||||||
Debt extinguishment costs |
– | – | – | – | 65 | 65 | ||||||||||||
Transaction-related costs |
| – | | – | | – | | – | | 57 | | 57 | ||||||
| | | | | | | | | | | | | | | | | | | |
Adjusted income (loss) from operations |
$ | 1,848 | $ | 262 | $ | 324 | $ | 75 | $ | (253) | $ | 2,256 | ||||||
| | | | | | | | | | | | | | | | | | | |
Revenue from external customers includes premiums, fees and other revenues and mail order pharmacy revenues. The following table presents these revenues by product type for the years ended December 31:
| (In millions) |
2017 |
2016 |
2015 |
||||||
|---|---|---|---|---|---|---|---|---|---|
| | | | | | | | | | |
Global Health Care premiums by product: |
| | | ||||||
Guaranteed cost |
$ | 6,245 | $ | 4,610 | $ | 4,761 | |||
Experience-rated |
| 2,741 | | 2,383 | | 2,329 | |||
Stop loss |
3,483 | 3,082 | 2,701 | ||||||
International health care |
| 1,934 | | 1,859 | | 1,834 | |||
Dental |
1,791 | 1,586 | 1,392 | ||||||
Medicare |
| 5,534 | | 6,621 | | 6,142 | |||
Medicaid |
1,061 | 1,146 | 1,102 | ||||||
Medicare Part D |
| 764 | | 1,122 | | 1,589 | |||
Other |
985 | 886 | 846 | ||||||
| | | | | | | | | | |
Total premiums |
| 24,538 | | 23,295 | | 22,696 | |||
Fees |
4,503 | 4,368 | 4,107 | ||||||
| | | | | | | | | | |
Total Global Health Care premiums and fees |
| 29,041 | | 27,663 | | 26,803 | |||
Disability |
2,091 | 2,045 | 1,899 | ||||||
Life, Accident and Supplemental Health |
| 5,704 | | 5,300 | | 5,054 | |||
Mail order pharmacy |
2,979 | 2,966 | 2,536 | ||||||
Other |
| 338 | | 378 | | 374 | |||
| | | | | | | | | | |
Total |
$ | 40,153 | $ | 38,352 | $ | 36,666 | |||
| | | | | | | | | | |
Foreign and U.S. revenues from external customers for the three years ended December 31 are shown below. The Company's foreign revenues are generated by its foreign operating entities. In the periods shown, no foreign country contributed more than 5% of consolidated revenues from external customers.
| (In millions) |
2017 |
2016 |
2015 |
|||||||
|---|---|---|---|---|---|---|---|---|---|---|
| | | | | | | | | | | |
United States |
$ | 36,128 | $ | 34,672 | $ | 33,185 | ||||
South Korea |
1,892 | 1,666 | 1,521 | |||||||
All other foreign countries |
| 2,133 | | 2,014 | | 1,960 | ||||
| | | | | | | | | | | |
Total |
$ | 40,153 | $ | 38,352 | $ | 36,666 | ||||
| | | | | | | | | | | |
The Company had net receivables from CMS of $0.5 billion as of December 31, 2017 and $0.6 billion as of December 31, 2016. These amounts were included in premiums, accounts and notes receivable and reinsurance recoverables. As a percentage of consolidated revenues, premiums and fees from CMS were 17% in 2017, 20% in 2016 and 21% in 2015. These amounts were reported in the Global Health Care segment.
In 2016, the Company recorded an allowance for the balance of its risk corridor receivable from CMS of $124 million based on court decisions and the large risk corridor program deficit. As of December 31, 2017, the Company continues to hold an allowance for the balance of its risk corridor receivable of $109 million based on the current status of court decisions. However, the Company continues to believe that the government has a binding obligation to satisfy the risk corridor receivable.
| | | CIGNA CORPORATION - 2017 Form 10-K 107 |
PART II
ITEM 8. Financial Statements and Supplementary Data
Quarterly Financial Data (unaudited) |
The following unaudited quarterly financial data is presented on a consolidated basis for each of the years ended December 31, 2017 and December 31, 2016. Quarterly financial results necessarily rely heavily on estimates. This and certain other factors, such as the seasonal nature of portions of the insurance business, suggest the need to exercise caution in drawing specific conclusions from quarterly consolidated results.
|
Three Months Ended |
||||||||||||
| | | | | | | | | | | | | | |
(In millions, except per share amounts) |
March 31, | June 30, | September 30, | December 31, | |||||||||
| | | | | | | | | | | | | | |
Consolidated Results |
| | | | |||||||||
2017 |
|||||||||||||
Total revenues |
$ | 10,385 | $ | 10,318 | $ | 10,382 | $ | 10,531 | |||||
Income before income taxes |
890 | 1,134 | 824 | 758 | |||||||||
Shareholders' net income |
| 598 | (1) | | 813 | (1) | | 560 | (1) | | 266 | (1) | |
Shareholders' net income per share |
|||||||||||||
Basic |
| 2.34 | | 3.20 | | 2.25 | | 1.09 | |||||
Diluted |
2.30 | 3.15 | 2.21 | 1.07 | |||||||||
2016 |
| | | | |||||||||
Total revenues |
$ | 9,884 | $ | 9,960 | $ | 9,880 | $ | 9,944 | |||||
Income before income taxes |
| 819 | | 813 | | 742 | | 605 | |||||
Shareholders' net income |
519 | (1) | 510 | (1) | 456 | (1) | 382 | (1) | |||||
Shareholders' net income per share |
| | | | |||||||||
Basic |
2.04 | 2.00 | 1.79 | 1.49 | |||||||||
Diluted |
| 2.00 | | 1.97 | | 1.76 | | 1.47 | |||||
Stock and dividend data |
|||||||||||||
2017 |
| | | | |||||||||
Price range of common stock – high |
$ | 154.83 | $ | 173.21 | $ | 188.36 | $ | 212.46 | |||||
– low |
$ | 133.52 | $ | 146.70 | $ | 166.81 | $ | 183.08 | |||||
Dividends declared per common share |
$ | 0.04 | $ | – | $ | – | $ | – | |||||
2016 |
| | | | |||||||||
Price range of common stock – high |
$ | 147.93 | $ | 142.91 | $ | 148.99 | $ | 142.00 | |||||
– low |
$ | 123.54 | $ | 121.87 | $ | 123.53 | $ | 115.03 | |||||
Dividends declared per common share |
$ | 0.04 | $ | – | $ | – | $ | – | |||||
| | | | | | | | | | | | | | |
| |
March 31, |
June 30, |
September 30, |
December 31, |
|||||||||
|---|---|---|---|---|---|---|---|---|---|---|---|---|---|
| | | | | | | | | | | | | | |
2017 U.S. tax reform |
$ | – | $ | – | $ | – | $ | 196 | |||||
2017 Debt extinguishment costs |
– | – | 209 | – | |||||||||
2017 Long-term care guaranty fund assessment |
| 83 | | – | | – | | – | |||||
2017 Transaction-related costs |
49 | (47) | 6 | 25 | |||||||||
| | | | | | | | | | | | | | |
Total 2017 charges (benefits) |
$ | 132 | $ | (47) | $ | 215 | $ | 221 | |||||
| | | | | | | | | | | | | | |
2016 Risk corridor allowance |
$ | – | $ | – | $ | – | $ | 80 | |||||
2016 Transaction-related costs |
| 36 | | 26 | | 46 | | 39 | |||||
2016 Charges associated with litigation matters |
– | – | 25 | – | |||||||||
| | | | | | | | | | | | | | |
Total 2016 charges |
$ | 36 | $ | 26 | $ | 71 | $ | 119 | |||||
| | | | | | | | | | | | | | |
| 108 CIGNA CORPORATION - 2017 Form 10-K | | |
PART II
ITEM 9. Changes in and Disagreements with Accountants on Accounting and Financial Disclosure
ITEM 9. Changes in and Disagreements with Accountants on Accounting and Financial Disclosure |
ITEM 9A. Controls and Procedures |
A. Disclosure Controls and Procedures |
Based on an evaluation of the effectiveness of Cigna's disclosure controls and procedures conducted under the supervision and with the participation of Cigna's management, Cigna's Chief Executive Officer and Chief Financial Officer concluded that, as of the end of the period covered by this report, Cigna's disclosure controls and procedures are effective to ensure that information required to be disclosed by Cigna in the reports that it files or submits under the Exchange Act is recorded, processed, summarized and reported, within the time periods specified in the SEC's rules and forms.
B. Internal Control Over Financial Reporting |
Management's Annual Report on Internal Control over Financial Reporting |
Management of Cigna Corporation is responsible for establishing and maintaining adequate internal controls over financial reporting. The Company's internal controls were designed to provide reasonable assurance to the Company's management and Board of Directors that the Company's consolidated published financial statements for external purposes were prepared in accordance with accounting principles generally accepted in the United States. The Company's internal control over financial reporting includes those policies and procedures that:
Because of its inherent limitations, internal control over financial reporting may not prevent or detect misstatements.
Management assessed the effectiveness of the Company's internal controls over financial reporting as of December 31, 2017. In making this assessment, management used the criteria set forth by the Committee of Sponsoring Organizations of the Treadway Commission ("COSO") in Internal Control-Integrated Framework (2013). Based on management's assessment and the criteria set forth by COSO, it was determined that the Company's internal controls over financial reporting are effective as of December 31, 2017.
The Company's independent registered public accounting firm, PricewaterhouseCoopers LLP, has audited the effectiveness of the Company's internal control over financial reporting, as stated in their report located on page 57 in this Form 10-K.
ITEM 9B. Other Information |
None.
| | | CIGNA CORPORATION - 2017 Form 10-K 109 |
PART III
ITEM 10. Directors, Executive Officers and Corporate Governance
PART III |
ITEM 10. Directors, Executive Officers and Corporate Governance |
A. Directors of the Registrant |
The information under the captions "Corporate Governance Matters – Process for Director Elections," " – Board of Directors' Nominees" and " – Board Meetings and Committees" (as it relates to Audit Committee disclosure) in Cigna's definitive proxy statement related to the 2018 annual meeting of shareholders is incorporated by reference.
B. Executive Officers of the Registrant |
See PART I – "Executive Officers of the Registrant" on page 31 in this Form 10-K.
C. Code of Ethics and Other Corporate Governance Disclosures |
The information under the caption "Corporate Governance Matters – Codes of Ethics" in Cigna's definitive proxy statement related to the 2018 annual meeting of shareholders is incorporated by reference.
D. Section 16(a) Beneficial Ownership Reporting Compliance |
The information under the caption "Ownership of Cigna Common Stock – Section 16(a) Beneficial Ownership Reporting Compliance" in Cigna's definitive proxy statement related to the 2018 annual meeting of shareholders is incorporated by reference.
ITEM 11. Executive Compensation |
The information under the captions "Corporate Governance Matters – Non-Employee Director Compensation," "Compensation Matters – Compensation Discussion and Analysis," " – Report of the People Resources Committee" and " – Executive Compensation Tables" in Cigna's definitive proxy statement related to the 2018 annual meeting of shareholders is incorporated by reference.
| 110 CIGNA CORPORATION - 2017 Form 10-K | | |
PART III
ITEM 12. Security Ownership of Certain Beneficial Owners and Management and Related Stockholder Matters
ITEM 12. Security Ownership of Certain Beneficial Owners and Management and Related Stockholder Matters |
The following table presents information regarding Cigna's equity compensation plans as of December 31, 2017:
| Plan Category |
(a) (1) Securities To Be Issued Upon Exercise Of Outstanding Options, Warrants And Rights |
(b) (2) Weighted Average Exercise Price Per Share Of Outstanding Options, Warrants And Rights |
(c) (3) Securities Remaining Available For Future Issuance Under Equity Compensation Plans (Excluding Securities Reflected In Column (a)) |
|||||||
|---|---|---|---|---|---|---|---|---|---|---|
| | | | | | | | | | | |
Equity Compensation Plans Approved by Security Holders |
| 7,959,003 | $ | 100.79 | | 14,262,573 | ||||
Equity Compensation Plans Not Approved by Security Holders |
– | – | – | |||||||
| | | | | | | | | | | |
Total |
| 7,959,003 | $ | 100.79 | | 14,262,573 | ||||
| | | | | | | | | | | |
The information under the captions "Ownership of Cigna Common Stock — Stock Held by Directors, Nominees and Executive Officers" and "Ownership of Cigna Common Stock – Stock Held by Certain Beneficial Owners" in Cigna's definitive proxy statement related to the 2018 annual meeting of shareholders is incorporated by reference.
ITEM 13. Certain Relationships and Related Transactions, and Director Independence |
The information under the captions "Corporate Governance Matters – Director Independence" and " – Certain Transactions" in Cigna's definitive proxy statement related to the 2018 annual meeting of shareholders is incorporated by reference.
ITEM 14. Principal Accountant Fees and Services |
The information under the captions "Audit Matters – Policy for the Pre-Approval of Audit and Non-Audit Services" and " – Fees to Independent Registered Public Accounting Firm" in Cigna's definitive proxy statement related to the 2018 annual meeting of shareholders is incorporated by reference.
| | | CIGNA CORPORATION - 2017 Form 10-K 111 |
PART IV
ITEM 15. Exhibits and Financial Statement Schedules
PART IV |
ITEM 15. Exhibits and Financial Statement Schedules |
Report of Independent Registered Public Accounting Firm.
Consolidated Statements of Income for the years ended December 31, 2017, 2016 and 2015.
Consolidated Statements of Comprehensive Income for the years ended December 31, 2017, 2016 and 2015.
Consolidated Balance Sheets as of December 31, 2017 and 2016.
Consolidated Statements of Changes in Total Equity for the years ended December 31, 2017, 2016 and 2015.
Consolidated Statements of Cash Flows for the years ended December 31, 2017, 2016 and 2015.
Notes to the Consolidated Financial Statements.
(2) The financial statement schedules are listed in the Index to Financial Statement Schedules on page FS-1.
| 112 CIGNA CORPORATION - 2017 Form 10-K | | |
PART IV
ITEM 15. Exhibits and Financial Statement Schedules
Index to Exhibits |
| Number |
Description |
Method of Filing |
||||
|---|---|---|---|---|---|---|
| | | | | | | |
| 3.1 | | Restated Certificate of Incorporation of the registrant as last amended October 28, 2011 | Filed as Exhibit 3.1 to the registrant's Form 10-Q for the quarterly period ended September 30, 2011 and incorporated herein by reference. | |||
| 3.2 | By-Laws of the registrant as last amended and restated December 7, 2017 | Filed as Exhibit 3.1 to the registrant's Form 8-K filed on December 13, 2017 and incorporated herein by reference. | ||||
| 4.1 | (a) | Indenture dated August 16, 2006 between Cigna Corporation and U.S. Bank National Association | Filed as Exhibit 4.1(a) to the registrant's Form 10-K for the year ended December 31, 2012 and incorporated herein by reference. | |||
| (b) | Supplemental Indenture No. 1 dated November 10, 2006 between Cigna Corporation and U.S. Bank National Association | Filed as Exhibit 4.1(b) to the registrant's Form 10-K for the year ended December 31, 2012 and incorporated herein by reference. | ||||
| | (c) | Supplemental Indenture No. 2 dated March 15, 2007 between Cigna Corporation and U.S. Bank National Association | Filed as Exhibit 4.1(c) to the registrant's Form 10-Q for the quarterly period ended March 31, 2011 and incorporated herein by reference. | |||
| (d) | Supplemental Indenture No. 3 dated March 7, 2008 between Cigna Corporation and U.S. Bank National Association | Filed as Exhibit 4.1 to the registrant's Form 8-K on March 10, 2008 and incorporated herein by reference. | ||||
| | (f) | Supplemental Indenture No. 5 dated May 17, 2010 between Cigna Corporation and U.S. Bank National Association | Filed as Exhibit 99.2 to the registrant's Form 8-K on May 28, 2010 and incorporated herein by reference. | |||
| (g) | Supplemental Indenture No. 6 dated December 8, 2010 between Cigna Corporation and U.S. Bank National Association | Filed as Exhibit 99.2 to the registrant's Form 8-K on December 9, 2010 and incorporated herein by reference. | ||||
| | (h) | Supplemental Indenture No. 7 dated March 7, 2011 between Cigna Corporation and U.S. Bank National Association | Filed as Exhibit 99.2 to the registrant's Form 8-K on March 8, 2011 and incorporated herein by reference. | |||
| (i) | Supplemental Indenture No. 8 dated November 10, 2011 between Cigna Corporation and U.S. Bank National Associated | Filed as Exhibit 4.1 to the registrant's Form 8-K on November 14, 2011 and incorporated herein by reference. | ||||
| | (j) | Supplemental Indenture No. 9 dated as of March 20, 2015, between Cigna Corporation and U.S. Bank National Association, as trustee. | Filed as Exhibit 4.1 to the registrant's Form 8-K on March 26, 2015 and incorporated herein by reference. | |||
| (k) | Supplemental Indenture No. 10 dated as of September 14, 2017 between Cigna Corporation and U.S. Bank National Association, as trustee | Filed as Exhibit 4.1 to the registrant's Form 8-K filed September 14, 2017 and incorporated herein by reference. | ||||
| 4.2 | | Indenture dated January 1, 1994 between Cigna Corporation and Marine Midland Bank | Filed as Exhibit 4.2 to the registrant's Form 10-K for the year ended December 31, 2009 and incorporated herein by reference. | |||
| 4.3 | Indenture dated June 30, 1988 between Cigna Corporation and Bankers Trust | Filed as Exhibit 4.3 to the registrant's Form 10-K for the year ended December 31, 2009 and incorporated herein by reference. | ||||
| Exhibits 10.1 through 10.36 are identified as compensatory plans, management contracts or arrangements pursuant to Item 15 of Form 10-K. | ||||||
| 10.1 | Deferred Compensation Plan for Directors of Cigna Corporation, as amended and restated January 1, 1997 | Filed as Exhibit 10.1 to the registrant's Form 10-K for the year ended December 31, 2011 and incorporated herein by reference. | ||||
| 10.2 | | Deferred Compensation Plan of 2005 for Directors of Cigna Corporation, Amended and Restated effective April 28, 2010 | Filed as Exhibit 10.2 to the registrant's Form 10-K for the year ended December 31, 2010 and incorporated herein by reference. | |||
| 10.3 | Cigna Corporation Non-Employee Director Compensation Program amended and restated effective February 26, 2014 | Filed as Exhibit 10.1 to the registrant's Form 10-Q for the quarterly period ended March 31, 2014 and incorporated herein by reference. | ||||
| 10.4 | | Cigna Restricted Share Equivalent Plan for Non-Employee Directors as amended and restated effective January 1, 2008 | Filed as Exhibit 10.4 to the registrant's Form 10-K for the year ended December 31, 2012 and incorporated herein by reference. | |||
| 10.5 | Cigna Corporation Director Equity Plan | Filed as Exhibit 10.3 to the registrant's Form 10-Q for the quarterly period ended March 31, 2010 and incorporated herein by reference. | ||||
| 10.6 | | Cigna Corporation Stock Plan, as amended and restated through July 2000 | Filed as Exhibit 10.7 to the registrant's Form 10-K for the year ended December 31, 2009 and incorporated herein by reference. | |||
| 10.7 | Cigna Stock Unit Plan, as amended and restated effective February 22, 2017 | Filed as Exhibit 10.5 to the registrant's Form 10-Q for the quarterly period ended March 31, 2017 and incorporated herein by reference. | ||||
| 10.8 | | Cigna Executive Severance Benefits Plan as amended and restated effective April 27, 2010 | Filed as Exhibit 10.2 to the registrant's Form 10-Q for the quarterly period ended June 30, 2010 and incorporated herein by reference. | |||
| 10.9 | Description of Severance Benefits for Executives in Non-Change of Control Circumstances | Filed as Exhibit 10.10 to the registrant's Form 10-K for the year ended December 31, 2009 and incorporated herein by reference. | ||||
| | | | | | | |
| | | CIGNA CORPORATION - 2017 Form 10-K 113 |
PART IV
ITEM 15. Exhibits and Financial Statement Schedules
| Number |
Description |
Method of Filing |
||||
|---|---|---|---|---|---|---|
| | | | | | | |
| 10.10 | | Cigna Executive Incentive Plan amended and restated as of January 1, 2012 | Filed as Exhibit 10.1 to the registrant's Form 10-Q for the quarterly period ended March 31, 2012 and incorporated herein by reference. | |||
| 10.11 | Cigna Long-Term Incentive Plan as amended and restated effective as of April 26, 2017 | Filed as Exhibit 10.1 to the registrant's Form 8-K filed May 1, 2017 and incorporated herein by reference. | ||||
| 10.12 | | Cigna Deferred Compensation Plan, as amended and restated October 24, 2001 | Filed as Exhibit 10.14 to the registrant's Form 10-K for the year ended December 31, 2011 and incorporated herein by reference. | |||
| 10.13 | Cigna Deferred Compensation Plan of 2005 effective as of January 1, 2005 | Filed as Exhibit 10.15 to the registrant's Form 10-K for the year ended December 31, 2012 and incorporated herein by reference. | ||||
| 10.14 | (a) | Cigna Supplemental Pension Plan as amended and restated effective August 1, 1998 | Filed as Exhibit 10.15(a) to the registrant's Form 10-K for the year ended December 31, 2009 and incorporated herein by reference. | |||
| (b) | Amendment No. 1 to the Cigna Supplemental Pension Plan, amended and restated effective as of September 1, 1999 | Filed as Exhibit 10.15(b) to the registrant's Form 10-K for the year ended December 31, 2009 and incorporated herein by reference. | ||||
| | (c) | Amendment No. 2 dated December 6, 2000 to the Cigna Supplemental Pension | Filed as Exhibit 10.16(c) to the registrant's Form 10-K for the year ended December 31, 2011 and incorporated herein by reference. | |||
| 10.15 | (a) | Cigna Supplemental Pension Plan of 2005 effective as of January 1, 2005 | Filed as Exhibit 10.15 to the registrant's Form 10-K for the year ended December 31, 2007 and incorporated herein by reference. | |||
| | (b) | Amendment No. 1 to the Cigna Supplemental Pension Plan of 2005 | Filed as Exhibit 10.1 to the registrant's Form 10-Q for the quarterly period ended June 30, 2009 and incorporated herein by reference. | |||
| 10.16 | Cigna Supplemental 401(k) Plan effective January 1, 2010 | Filed as Exhibit 10.17 to the registrant's Form 10-K for the year ended December 31, 2009 and incorporated herein by reference. | ||||
| 10.17 | | Description of Cigna Corporation Financial Services Program | Filed as Exhibit 10.18 to the registrant's Form 10-K for the year ended December 31, 2009 and incorporated herein by reference. | |||
| 10.18 | Form of Cigna Long-Term Incentive Plan: Strategic Performance Share Grant Agreement | Filed as Exhibit 10.2 to the registrant's Form 10-Q for the period ended March 31, 2017 and incorporated herein by reference. | ||||
| 10.19 | | Form of Cigna Long-Term Incentive Plan: Nonqualified Stock Option Grant Agreement | Filed as Exhibit 10.3 to the registrant's Form 10-Q for the period ended March 31, 2017 and incorporated herein by reference. | |||
| 10.20 | Form of Cigna Long-Term Incentive Plan: Restricted Stock Grant Agreement | Filed as Exhibit 10.4 to the registrant's Form 10-Q for the period ended March 31, 2017 and incorporated herein by reference. | ||||
| 10.21 | | Form of Cigna Long-Term Incentive Plan: Restricted Stock Unit Grant Agreement | Filed as Exhibit 10.6 to the registrant's Form 10-Q for the period ended March 31, 2017 and incorporated herein by reference. | |||
| 10.22 | Offer Letter for Eric P. Palmer dated June 16, 2017 | Filed as Exhibit 10.1 to the registrant's Form 8-K filed June 19, 2017 and incorporated herein by reference. | ||||
| 10.23 | | Schedule regarding Amended Deferred Stock Unit Agreements effective December 31, 2008 with John M. Murabito and Form of Amended Deferred Stock Unit Agreement | Filed as Exhibit 10.20 to the registrant's Form 10-K for the year ended December 31, 2008 and incorporated herein by reference. | |||
| 10.24 | Nicole Jones' Offer of Employment dated April 27, 2011 | Filed as Exhibit 10.2 to the registrant's Form 10-Q for the period ended March 31, 2012 and incorporated herein by reference. | ||||
| 10.25 | | Matthew Manders' Promotion Letter dated June 2, 2014 | Filed as Exhibit 10.1 to the registrant's Form 8-K filed on June 4, 2014 and incorporated herein by reference. | |||
| 10.26 | Agreement and Release between the Company and Matthew G. Manders dated October 16, 2017 | Filed as Exhibit 10.1 to the registrant's Form 8-K filed October 18, 2017 and incorporated herein by reference. | ||||
| 10.27 | | Thomas A. McCarthy's Offer Letter dated May 9, 2013 | Filed as Exhibit 10.1 to the registrant's Form 8-K filed on May 13, 2013 and incorporated herein by reference. | |||
| 10.28 | Agreement and Release between the Company and Thomas A. McCarthy dated June 16, 2017 | Filed as Exhibit 10.2 to the registrant's Form 8-K filed June 19, 2017 and incorporated herein by reference. | ||||
| 10.29 | | Advisory Services Agreement between the Company and Thomas A. McCarthy dated June 16, 2017 | Filed as Exhibit 10.3 to the registrant's Form 8-K filed June 19, 2017 and incorporated herein by reference. | |||
| 10.30 | Employment Agreement for Jason D. Sadler dated May 7, 2010 | Filed as Exhibit 10.1(a) to the registrant's Form 10-Q for the period ended March 31, 2015 and incorporated herein by reference. | ||||
| | | | | | | |
| 114 CIGNA CORPORATION - 2017 Form 10-K | | |
PART IV
ITEM 15. Exhibits and Financial Statement Schedules
| Number |
Description |
Method of Filing |
||||
|---|---|---|---|---|---|---|
| | | | | | | |
| 10.31 | | Promotion letter for Jason Sadler dated June 2, 2014 | Filed as Exhibit 10.1(b) to the registrant's Form 10-Q for the period ended March 31, 2015 and incorporated herein by reference. | |||
| 10.32 | Agreement and Release between Cigna Corporation and Herbert A. Fritch dated October 20, 2016 | Filed as Exhibit 10.1 to the registrant's Form 8-K filed on October 21, 2016 and incorporated herein by reference | ||||
| 10.33 | | Advisory Services Agreement between Cigna Corporation and Herbert A. Fritch dated October 20, 2016 | Filed as Exhibit 10.2 to the registrant's Form 8-K filed on October 21, 2016 and incorporated herein by reference | |||
| 10.34 | HealthSpring, Inc. Amended and Restated 2006 Equity Incentive Plan (the "HealthSpring Equity Incentive Plan") | Filed as Exhibit 10.3 to the registrant's Form 10-Q for the period ended March 31, 2013 and incorporated herein by reference. | ||||
| 10.35 | | HealthSpring Equity Incentive Plan: Form of Restricted Share Award | Filed as Exhibit 10.4 to the registrant's Form 10-Q for the period ended March 31, 2013 and incorporated herein by reference. | |||
| 10.36 | HealthSpring Equity Incentive Plan: Form of Non-Qualified Stock Option Agreement | Filed as Exhibit 10.5 to the registrant's Form 10-Q for the period ended March 31, 2013 and incorporated herein by reference. | ||||
| 10.37 | | Master Transaction Agreement, dated February 4, 2013 among Connecticut General Life Insurance Company, Berkshire Hathaway Life Insurance Company of Nebraska and, solely for purposes of Sections 3.10, 6.1, 6.3, 6.4, 6.6, 6.9 and Articles II, V, VII, and VIII, thereof, National Indemnity Company (including the Forms of Retrocession Agreement, the Collateral Trust Agreement, the Security and Control Agreement, the Surety Policy and the ALC Model Purchase Option Agreement as exhibits) | Filed as Exhibit 10.29 to the registrant's Form 10-K for the year ended December 31, 2012 and incorporated herein by reference. | |||
| 12 | Computation of Ratios of Earnings to Fixed Charges | Filed herewith. | ||||
| 21 | | Subsidiaries of the Registrant | Filed herewith. | |||
| 23 | Consent of Independent Registered Public Accounting Firm | Filed herewith. | ||||
| 31.1 | | Certification of Chief Executive Officer of Cigna Corporation pursuant to Rule 13a-14(a) or Rule 15d-14(a) of the Securities Exchange Act of 1934 | Filed herewith. | |||
| 31.2 | Certification of Chief Financial Officer of Cigna Corporation pursuant to Rule 13a-14(a) or Rule 15d-14(a) of the Securities Exchange Act of 1934 | Filed herewith. | ||||
| 32.1 | | Certification of Chief Executive Officer of Cigna Corporation pursuant to Rule 13a-14(b) or Rule 15d-14(b) and 18 U.S.C. Section 1350 | Furnished herewith. | |||
| 32.2 | Certification of Chief Financial Officer of Cigna Corporation pursuant to Rule 13a-14(b) or Rule 15d-14(b) and 18 U.S.C. Section 1350 | Furnished herewith. | ||||
| 101 | | The following materials from Cigna Corporation's Annual Report on Form 10-K for the year ended December 31, 2017, formatted in XBRL (Extensible Business Reporting Language): (i) the Consolidated Balance Sheets; (ii) the Consolidated Statements of Income; (iii) the Consolidated Statements of Comprehensive Income; (iv) the Consolidated Statements of Cash Flows; (v) the Consolidated Statements of Changes in Total Equity; (vi) the Notes to Consolidated Financial Statements and (vii) Financial Statement Schedules I, II, III, IV and V. | Filed herewith. | |||
| | | | | | | |
The registrant will furnish to the Commission upon request of any other instruments defining the rights of holders of long-term debt.
Shareholders may obtain copies of exhibits by writing to Cigna Corporation, Shareholder Services Department, 1601 Chestnut Street, Philadelphia, PA 19192.
ITEM 16. 10-K Summary |
None.
| | | CIGNA CORPORATION - 2017 Form 10-K 115 |
PART IV
ITEM 15. Signatures
SIGNATURES |
Pursuant to the requirements of Section 13 or 15(d) of the Securities Exchange Act of 1934, the registrant has duly caused this report to be signed on its behalf by the undersigned, thereunto duly authorized.
| CIGNA CORPORATION |
||||
|---|---|---|---|---|
| | | | | |
| Date: | February 28, 2018 | | ||
| By: | /s/ ERIC P. PALMER | |||
| | | | | |
| | Eric P. Palmer | | ||
| Executive Vice President and Chief Financial Officer (Principal Financial Officer) | ||||
| | | | | |
Pursuant to the requirements of the Securities Exchange Act of 1934, this report has been signed below by the following persons on behalf of the registrant and in the capacities indicated as of February 28, 2018.
| Signature |
Title |
|
|---|---|---|
| | | |
| /s/ DAVID M. CORDANI | Chief Executive Officer and Director (Principal Executive Officer) | |
| | | |
| David M. Cordani | ||
| /s/ ERIC P. PALMER | Executive Vice President and Chief Financial Officer (Principal Financial Officer) | |
| | | |
| Eric P. Palmer | ||
| /s/ MARY T. AGOGLIA HOELTZEL | Vice President and Chief Accounting Officer (Principal Accounting Officer) | |
| | | |
| Mary T. Agoglia Hoeltzel | ||
| /s/ ERIC J. FOSS | Director | |
| | | |
| Eric J. Foss | ||
| /s/ ISAIAH HARRIS, JR. | Chairman of the Board | |
| | | |
| Isaiah Harris, Jr. | ||
| /s/ JANE E. HENNEY, M.D. | Director | |
| | | |
| Jane E. Henney, M.D. | ||
| /s/ ROMAN MARTINEZ IV | Director | |
| | | |
| Roman Martinez IV | ||
| /s/ JOHN M. PARTRIDGE | Director | |
| | | |
| John M. Partridge | ||
| /s/ JAMES E. ROGERS | Director | |
| | | |
| James E. Rogers | ||
| /s/ ERIC C. WISEMAN | Director | |
| | | |
| Eric C. Wiseman | ||
| /s/ DONNA F. ZARCONE | Director | |
| | | |
| Donna F. Zarcone | ||
| /s/ WILLIAM D. ZOLLARS | Director | |
| | | |
| William D. Zollars | ||
| | | |
| 116 CIGNA CORPORATION - 2017 Form 10-K | | |
PART IV
ITEM 15. Exhibits and Financial Statement Schedules
Cigna Corporation and Subsidiaries |
INDEX TO FINANCIAL STATEMENT |
Schedules other than those listed above are omitted because they are not required or are not applicable, or the required information is shown in the financial statements or notes thereto.
| | | CIGNA CORPORATION - 2017 Form 10-K FS-1 |
PART IV
ITEM 15. Report of Independent Registered Public Accounting Firm on Financial Statement Schedules
Report of Independent Registered Public Accounting Firm on Financial Statement Schedules |
To the Board of Directors and Shareholders of Cigna Corporation
Our audits of the consolidated financial statements referred to in our report dated February 28, 2018 (which report and consolidated financial statements are included under Item 8 in this Annual Report on Form 10-K) also included an audit of the financial statement schedules listed in Item 15(a)(2) of this Form 10-K. In our opinion, these financial statement schedules present fairly, in all material respects, the information set forth therein when read in conjunction with the related consolidated financial statements.
/s/
PricewaterhouseCoopers LLP
Hartford, Connecticut
February 28, 2018
| FS-2 CIGNA CORPORATION - 2017 Form 10-K | | |
PART IV
ITEM 15. Exhibits and Financial Statement Schedules
Cigna Corporation and Subsidiaries |
| (in millions) Type of Investment |
Cost |
Fair Value |
Amount at which shown in the Consolidated Balance Sheet |
|||||
|---|---|---|---|---|---|---|---|---|
| | | | | | | | | |
Fixed maturities |
| | ||||||
Bonds |
||||||||
United States government and government agencies and authorities |
$ | 541 | $ | 779 | $ 779 | |||
States, municipalities and political subdivisions |
1,196 | 1,287 | 1,287 | |||||
Foreign governments |
| 2,360 | | 2,487 | 2,487 | |||
Public utilities |
2,187 | 2,342 | 2,342 | |||||
All other corporate bonds |
| 15,107 | | 15,739 | 15,739 | |||
Mortgage and other asset-backed |
469 | 497 | 497 | |||||
Redeemable preferred stocks |
| 7 | | 7 | 7 | |||
| | | | | | | | | |
TOTAL FIXED MATURITIES |
21,867 | 23,138 | 23,138 | |||||
| | | | | | | | | |
Equity securities |
| | ||||||
Common stocks |
||||||||
Industrial, miscellaneous and all other |
| 485 | | 496 | 496 | |||
Non-redeemable preferred stocks |
104 | 92 | 92 | |||||
| | | | | | | | | |
TOTAL EQUITY SECURITIES |
| 589 | | 588 | 588 | |||
| | | | | | | | | |
Commercial mortgage loans on real estate |
1,761 | 1,761 | ||||||
Policy loans |
| 1,415 | | | 1,415 | |||
Other long-term investments |
1,518 | 1,518 | ||||||
Short-term investments |
| 199 | | | 199 | |||
| | | | | | | | | |
TOTAL INVESTMENTS |
$ | 27,349 | $ 28,619 | |||||
| | | | | | | | | |
| | | CIGNA CORPORATION - 2017 Form 10-K FS-3 |
PART IV
ITEM 15. Exhibits and Financial Statement Schedules
Cigna Corporation and Subsidiaries |
Statements of Income |
|
For the years ended December 31, |
||||||||
| | | | | | | | | | |
(in millions) |
2017 | 2016 | 2015 |
||||||
| | | | | | | | | | |
Operating expenses |
| | | ||||||
Interest |
$ | 237 | $ | 244 | $ | 246 | |||
Intercompany interest |
| 18 | | 3 | | 2 | |||
Debt extinguishment costs |
321 | — | 100 | ||||||
Other |
| 204 | | 281 | | 147 | |||
| | | | | | | | | | |
TOTAL OPERATING EXPENSES |
780 | 528 | 495 | ||||||
| | | | | | | | | | |
Loss before income taxes |
| (780) | | (528) | | (495) | |||
Income tax benefit |
(194) | (146) | (135) | ||||||
| | | | | | | | | | |
Loss of parent company |
| (586) | | (382) | | (360) | |||
Equity in income of subsidiaries |
2,823 | 2,249 | 2,454 | ||||||
| | | | | | | | | | |
SHAREHOLDERS' NET INCOME |
| 2,237 | | 1,867 | | 2,094 | |||
| | | | | | | | | | |
Shareholders' other comprehensive income (loss) |
|||||||||
Net unrealized (depreciation) on securities |
| (34) | | (56) | | (202) | |||
Net unrealized (depreciation) appreciation on derivatives |
(3) | (4) | 15 | ||||||
Net translation of foreign currencies |
| 304 | | (95) | | (212) | |||
Postretirement benefits liability adjustment |
33 | 23 | 85 | ||||||
| | | | | | | | | | |
Shareholders' other comprehensive income (loss): |
| 300 | | (132) | | (314) | |||
| | | | | | | | | | |
SHAREHOLDERS' COMPREHENSIVE INCOME |
$ | 2,537 | $ | 1,735 | $ | 1,780 | |||
| | | | | | | | | | |
| | | | | | | | | | |
| | | | | | | | | | |
See Notes to Financial Statements on the following pages.
| FS-4 CIGNA CORPORATION - 2017 Form 10-K | | |
PART IV
ITEM 15. Exhibits and Financial Statement Schedules
Cigna Corporation and Subsidiaries |
Balance Sheets |
| |
As of December 31, |
|||||
|---|---|---|---|---|---|---|
| | | | | | | |
(in millions) |
2017 | 2016 | ||||
| | | | | | | |
Assets |
| | ||||
Cash and cash equivalents |
$ | 9 | $ | 18 | ||
Short-term investments |
| 63 | | 57 | ||
Investments in subsidiaries |
22,655 | 20,315 | ||||
Intercompany receivable |
| 200 | | 173 | ||
Other assets |
252 | 415 | ||||
| | | | | | | |
TOTAL ASSETS |
$ | 23,179 | $ | 20,978 | ||
| | | | | | | |
Liabilities |
||||||
Intercompany payable |
$ | 2,980 | $ | 998 | ||
Short-term debt |
231 | 257 | ||||
Long-term debt |
| 5,112 | | 4,658 | ||
Other liabilities |
1,121 | 1,342 | ||||
| | | | | | | |
TOTAL LIABILITIES |
| 9,444 | | 7,255 | ||
| | | | | | | |
Shareholders' Equity |
||||||
Common stock (shares issued, 296; authorized, 600) |
| 74 | | 74 | ||
Additional paid-in capital |
2,940 | 2,892 | ||||
Accumulated other comprehensive loss |
| (1,082) | | (1,382) | ||
Retained earnings |
15,824 | 13,855 | ||||
Less treasury stock, at cost |
| (4,021) | | (1,716) | ||
| | | | | | | |
TOTAL SHAREHOLDERS' EQUITY |
13,735 | 13,723 | ||||
| | | | | | | |
TOTAL LIABILITIES AND SHAREHOLDERS' EQUITY |
$ | 23,179 | $ | 20,978 | ||
| | | | | | | |
See Notes to Financial Statements on the following pages.
| | | CIGNA CORPORATION - 2017 Form 10-K FS-5 |
PART IV
ITEM 15. Exhibits and Financial Statement Schedules
Cigna Corporation and Subsidiaries |
Statements of Cash Flows |
| For the years ended December 31, |
|||||||||
| | | | | | | | | | |
| (in millions) |
2017 |
2016 |
2015 |
||||||
|---|---|---|---|---|---|---|---|---|---|
| | | | | | | | | | |
| Cash Flows from Operating Activities | | | | ||||||
| Shareholders' net income | $ | 2,237 | $ | 1,867 | $ | 2,094 | |||
| Adjustments to reconcile shareholders' net income to net cash provided by operating activities | | | | ||||||
Equity in income of subsidiaries |
(2,823) | (2,249) | (2,454) | ||||||
Dividends received from subsidiaries |
| 758 | | 580 | | 880 | |||
Other liabilities |
(224) | (9) | 112 | ||||||
Debt extinguishment costs |
| 321 | | – | | 100 | |||
Other, net (1) |
333 | 187 | 112 | ||||||
| | | | | | | | | | |
NET CASH PROVIDED BY OPERATING ACTIVITIES (1) |
| 602 | | 376 | | 844 | |||
| | | | | | | | | | |
| Cash Flows from Investing Activities | |||||||||
| Short-term investment purchased, net | | (6) | | (3) | | (54) | |||
| Other, net | (11) | (8) | (14) | ||||||
| | | | | | | | | | |
NET CASH (USED IN) INVESTING ACTIVITIES |
| (17) | | (11) | | (68) | |||
| Cash Flows from Financing Activities | |||||||||
| Net change in amounts due to (from) affiliates | | 1,955 | | (78) | | (161) | |||
| Net change in short-term debt | 100 | (100) | – | ||||||
| Payments for debt extinguishment | | (313) | | – | | (87) | |||
| Repayment of long-term debt | (1,250) | – | (851) | ||||||
| Net proceeds on issuance of long-term debt | | 1,581 | | – | | 894 | |||
| Issuance of common stock | 131 | 36 | 154 | ||||||
| Common dividends paid | | (10) | | (10) | | (10) | |||
| Repurchase of common stock | (2,725) | (139) | (671) | ||||||
| Tax withholding on stock compensation (1) | | (61) | | (72) | | (79) | |||
| Other | (2) | – | – | ||||||
| | | | | | | | | | |
NET CASH (USED IN) FINANCING ACTIVITIES (1) |
| (594) | | (363) | | (811) | |||
| Net (decrease) increase in cash and cash equivalents | (9) | 2 | (35) | ||||||
| Cash and cash equivalents, beginning of year | | 18 | | 16 | | 51 | |||
| | | | | | | | | | |
| Cash and cash equivalents, end of year | $ | 9 | $ | 18 | $ | 16 | |||
| | | | | | | | | | |
See Notes to Financial Statements on the following pages.
| FS-6 CIGNA CORPORATION - 2017 Form 10-K | | |
PART IV
ITEM 15. Exhibits and Financial Statement Schedules
Cigna Corporation and Subsidiaries |
Notes to Condensed Financial Statements |
The accompanying condensed financial statements should be read in conjunction with the Consolidated Financial Statements and the accompanying notes thereto contained in this Annual Report on Form 10-K ("Form 10-K").
Note 1 – For purposes of these condensed financial statements, Cigna Corporation's (the "Company") wholly-owned and majority-owned subsidiaries are recorded using the equity basis of accounting.
Note 2 – See Note 5 – Debt included in Part II, Item 8 of this Form 10-K for a description of the short-term and long-term debt obligations of Cigna Corporation and its subsidiaries. All debt is a direct obligation of Cigna Corporation, except for $78 million of 6.37% Notes due 2021 and $18 million of capital leases.
Note 3 – Intercompany liabilities consist primarily of payables to Cigna Holdings, Inc. of $2.8 billion as of December 31, 2017 and $0.7 billion as of December 31, 2016. Interest was accrued at an average monthly rate of 1.47% for 2017 and 0.93% for 2016.
Note 4 – The Company had guarantees of approximately $235 million as of December 31, 2017. These guarantees are primarily to secure payment obligations or solvency requirements of certain wholly-owned subsidiaries. In 2017, no payments have been made on these guarantees.
| | | CIGNA CORPORATION - 2017 Form 10-K FS-7 |
PART IV
ITEM 15. Exhibits and Financial Statement Schedules
Cigna Corporation and Subsidiaries |
| (in millions) Segment |
Deferred policy acquisition costs |
Future policy benefits and contractholder deposit funds |
Medical costs payable and unpaid claims(1) |
Unearned premiums |
||||||||
|---|---|---|---|---|---|---|---|---|---|---|---|---|
| | | | | | | | | | | | | |
Year Ended December 31, 2017 |
| | | | ||||||||
Global Health Care |
$ | 15 | $ | 157 | $ | 2,719 | $ | 213 | ||||
Global Supplemental Benefits |
| 2,176 | | 3,746 | | 484 | | 490 | ||||
Group Disability and Life |
1 | 1,686 | 4,491 | 7 | ||||||||
Other Operations |
| 45 | | 12,647 | | 193 | | 14 | ||||
Corporate |
– | – | – | – | ||||||||
| | | | | | | | | | | | | |
Total |
$ | 2,237 | $ | 18,236 | $ | 7,887 | $ | 724 | ||||
| | | | | | | | | | | | | |
Year Ended December 31, 2016 |
||||||||||||
Global Health Care |
$ | 16 | $ | 161 | $ | 2,532 | $ | 170 | ||||
Global Supplemental Benefits |
1,752 | 3,225 | 384 | 435 | ||||||||
Group Disability and Life |
| 1 | | 1,786 | | 4,342 | | 13 | ||||
Other Operations |
49 | 12,934 | 191 | 16 | ||||||||
Corporate |
| – | | – | | – | | – | ||||
| | | | | | | | | | | | | |
Total |
$ | 1,818 | $ | 18,106 | $ | 7,449 | $ | 634 | ||||
| | | | | | | | | | | | | |
Year Ended December 31, 2015 |
| | | | ||||||||
Global Health Care |
$ | 11 | $ | 169 | $ | 2,355 | $ | 145 | ||||
Global Supplemental Benefits |
| 1,593 | | 3,006 | | 353 | | 453 | ||||
Group Disability and Life |
1 | 1,714 | 4,006 | 13 | ||||||||
Other Operations |
| 54 | | 13,033 | | 215 | | 18 | ||||
Corporate |
– | – | – | – | ||||||||
| | | | | | | | | | | | | |
Total |
$ | 1,659 | $ | 17,922 | $ | 6,929 | $ | 629 | ||||
| | | | | | | | | | | | | |
| FS-8 CIGNA CORPORATION - 2017 Form 10-K | | |
PART IV
ITEM 15. Exhibits and Financial Statement Schedules
| Segment |
Premiums(2) |
Net investment income(3) |
Benefit expenses(2)(4) |
Amortization of deferred policy acquisition expenses |
Other operating expenses(5) |
||||||||||
|---|---|---|---|---|---|---|---|---|---|---|---|---|---|---|---|
| | | | | | | | | | | | | | | | |
Year Ended December 31, 2017 |
| | | | | ||||||||||
Global Health Care |
$ | 24,538 | $ | 378 | $ | 19,967 | $ | 56 | $ | 9,417 | |||||
Global Supplemental Benefits |
| 3,684 | | 122 | | 2,033 | | 259 | | 1,115 | |||||
Group Disability and Life |
3,985 | 350 | 3,076 | 1 | 967 | ||||||||||
Other Operations |
| 112 | | 346 | | 342 | | 6 | | (32) | |||||
Corporate |
(12) | 30 | (12) | – | 815 | ||||||||||
| | | | | | | | | | | | | | | | |
Total |
$ | 32,307 | $ | 1,226 | $ | 25,406 | $ | 322 | $ | 12,282 | |||||
| | | | | | | | | | | | | | | | |
Year Ended December 31, 2016 |
|||||||||||||||
Global Health Care |
$ | 23,295 | $ | 315 | $ | 19,009 | $ | 47 | $ | 9,411 | |||||
Global Supplemental Benefits |
3,226 | 110 | 1,784 | 238 | 1,030 | ||||||||||
Group Disability and Life |
| 4,002 | | 343 | | 3,354 | | 1 | | 918 | |||||
Other Operations |
103 | 358 | 339 | 6 | 24 | ||||||||||
Corporate |
| – | | 21 | | – | | – | | 528 | |||||
| | | | | | | | | | | | | | | | |
Total |
$ | 30,626 | $ | 1,147 | $ | 24,486 | $ | 292 | $ | 11,911 | |||||
| | | | | | | | | | | | | | | | |
Year Ended December 31, 2015 |
| | | | | ||||||||||
Global Health Care |
$ | 22,696 | $ | 340 | $ | 18,354 | $ | 53 | $ | 8,621 | |||||
Global Supplemental Benefits |
| 3,000 | | 103 | | 1,659 | | 227 | | 963 | |||||
Group Disability and Life |
3,843 | 337 | 2,934 | 1 | 861 | ||||||||||
Other Operations |
| 103 | | 369 | | 343 | | 5 | | 26 | |||||
Corporate |
– | 4 | – | – | 502 | ||||||||||
| | | | | | | | | | | | | | | | |
Total |
$ | 29,642 | $ | 1,153 | $ | 23,290 | $ | 286 | $ | 10,973 | |||||
| | | | | | | | | | | | | | | | |
| | | CIGNA CORPORATION - 2017 Form 10-K FS-9 |
PART IV
ITEM 15. Exhibits and Financial Statement Schedules
Cigna Corporation and Subsidiaries |
| (in millions) |
Gross amount |
Ceded to other companies |
Assumed from other companies |
Net amount |
Percentage of amount assumed to net |
||||||||||
|---|---|---|---|---|---|---|---|---|---|---|---|---|---|---|---|
| | | | | | | | | | | | | | | | |
Year Ended December 31, 2017 |
| | | | | ||||||||||
Life insurance in force |
$ | 1,105,323 | $ | 49,172 | $ | 2,478 | $ | 1,058,629 | 0.2% | ||||||
| | | | | | | | | | | | | | | | |
Premiums |
| | | | | ||||||||||
Life insurance and annuities |
$ | 2,307 | $ | 233 | $ | 22 | $ | 2,096 | 1.0% | ||||||
Accident and health insurance |
| 30,095 | | 191 | | 307 | | 30,211 | | 1.0% | |||||
| | | | | | | | | | | | | | | | |
Total |
$ | 32,402 | $ | 424 | $ | 329 | $ | 32,307 | 1.0% | ||||||
| | | | | | | | | | | | | | | | |
Year Ended December 31, 2016 |
| | | | | ||||||||||
Life insurance in force |
$ | 1,047,002 | $ | 55,399 | $ | 2,827 | $ | 994,430 | 0.3% | ||||||
| | | | | | | | | | | | | | | | |
Premiums |
| | | | | ||||||||||
Life insurance and annuities |
$ | 2,881 | $ | 310 | $ | 22 | $ | 2,593 | 0.8% | ||||||
Accident and health insurance |
| 27,874 | | 203 | | 362 | | 28,033 | | 1.3% | |||||
| | | | | | | | | | | | | | | | |
Total |
$ | 30,755 | $ | 513 | $ | 384 | $ | 30,626 | 1.3% | ||||||
| | | | | | | | | | | | | | | | |
Year Ended December 31, 2015 |
| | | | | ||||||||||
Life insurance in force |
$ | 1,047,982 | $ | 72,208 | $ | 3,273 | $ | 979,047 | 0.3% | ||||||
| | | | | | | | | | | | | | | | |
Premiums |
| | | | | ||||||||||
Life insurance and annuities |
$ | 2,886 | $ | 335 | $ | 106 | $ | 2,657 | 4.0% | ||||||
Accident and health insurance |
| 26,926 | | 235 | | 294 | | 26,985 | | 1.1% | |||||
| | | | | | | | | | | | | | | | |
Total |
$ | 29,812 | $ | 570 | $ | 400 | $ | 29,642 | 1.3% | ||||||
| | | | | | | | | | | | | | | | |
| FS-10 CIGNA CORPORATION - 2017 Form 10-K | | |
PART IV
ITEM 15. Exhibits and Financial Statement Schedules
Cigna Corporation and Subsidiaries |
| (in millions) Description |
Balance at beginning of year |
Charged (Credited) to costs and expenses (1) |
Charged (Credited) to other accounts |
Other deductions (2) |
Balance at end of year |
||||||||||
|---|---|---|---|---|---|---|---|---|---|---|---|---|---|---|---|
| | | | | | | | | | | | | | | | |
| 2017 | | | | | | ||||||||||
| Investment asset valuation reserves | |||||||||||||||
Commercial mortgage loans |
$ | 5 | $ | 1 | $ | – | $ | (6) | $ | – | |||||
| Allowance for doubtful accounts | |||||||||||||||
Premiums, accounts and notes receivable |
$ | 200 | $ | 19 | $ | (11) | $ | (1) | $ | 207 | |||||
| Deferred tax asset valuation allowance | $ | 87 | $ | 11 | $ | (26) | $ | – | $ | 72 | |||||
| Reinsurance recoverables | $ | 3 | $ | – | $ | – | $ | – | $ | 3 | |||||
| 2016 | |||||||||||||||
| Investment asset valuation reserves | | | | | | ||||||||||
Commercial mortgage loans |
$ | 15 | $ | – | $ | – | $ | (10) | $ | 5 | |||||
| Allowance for doubtful accounts | | | | | | ||||||||||
Premiums, accounts and notes receivable |
$ | 75 | $ | 134 | $ | (8) | $ | (1) | $ | 200 | |||||
| Deferred tax asset valuation allowance | $ | 71 | $ | 21 | $ | (5) | $ | – | $ | 87 | |||||
| Reinsurance recoverables | $ | 3 | $ | – | $ | – | $ | – | $ | 3 | |||||
| 2015 | | | | | | ||||||||||
| Investment asset valuation reserves | |||||||||||||||
Commercial mortgage loans |
$ | 12 | $ | 7 | $ | – | $ | (4) | $ | 15 | |||||
| Allowance for doubtful accounts | |||||||||||||||
Premiums, accounts and notes receivable |
$ | 101 | $ | (10) | $ | (15) | $ | (1) | $ | 75 | |||||
| Deferred tax asset valuation allowance | $ | 49 | $ | 8 | $ | 14 | $ | – | $ | 71 | |||||
| Reinsurance recoverables | $ | 4 | $ | – | $ | (1) | $ | – | $ | 3 | |||||
| | | | | | | | | | | | | | | | |
| | | CIGNA CORPORATION - 2017 Form 10-K FS-11 |